|
Download Data (XLS File) |
|
|||||
|
|||||
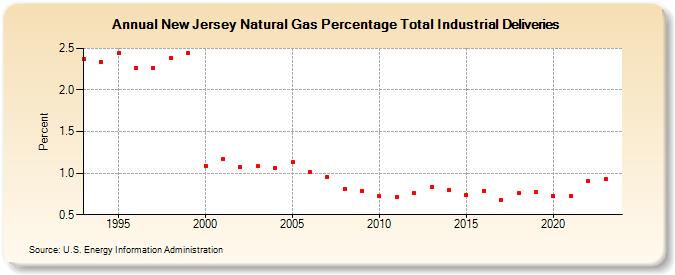
| New Jersey Natural Gas Percentage Total Industrial Deliveries (Percent) | |||||
| Decade | Year-0 | Year-1 | Year-2 | Year-3 | Year-4 | Year-5 | Year-6 | Year-7 | Year-8 | Year-9 |
|---|---|---|---|---|---|---|---|---|---|---|
| 1990's | 2.37 | 2.34 | 2.44 | 2.27 | 2.27 | 2.39 | 2.44 | |||
| 2000's | 1.09 | 1.17 | 1.07 | 1.08 | 1.06 | 1.13 | 1.01 | 0.95 | 0.81 | 0.79 |
| 2010's | 0.72 | 0.71 | 0.76 | 0.83 | 0.80 | 0.74 | 0.79 | 0.68 | 0.76 | 0.77 |
| 2020's | 0.72 | 0.72 | 0.90 | 0.93 | 0.72 |
| - = No Data Reported; -- = Not Applicable; NA = Not Available; W = Withheld to avoid disclosure of individual company data. |
| Release Date: 5/29/2026 |
| Next Release Date: 6/30/2026 |