|
Download Data (XLS File) |
|
|||||
|
|||||
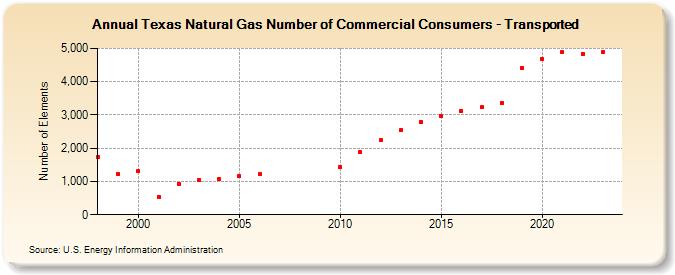
| Texas Natural Gas Number of Commercial Consumers - Transported (Number of Elements) | |||||
| Decade | Year-0 | Year-1 | Year-2 | Year-3 | Year-4 | Year-5 | Year-6 | Year-7 | Year-8 | Year-9 |
|---|---|---|---|---|---|---|---|---|---|---|
| 1990's | 1,743 | 1,226 | ||||||||
| 2000's | 1,302 | 537 | 932 | 1,050 | 1,070 | 1,161 | 1,212 | |||
| 2010's | 1,435 | 1,877 | 2,237 | 2,543 | 2,785 | 2,962 | 3,121 | 3,228 | 3,363 | 4,421 |
| 2020's | 4,679 | 4,879 | 4,833 | 4,880 | 4,974 |
| - = No Data Reported; -- = Not Applicable; NA = Not Available; W = Withheld to avoid disclosure of individual company data. |
| Release Date: 6/30/2026 |
| Next Release Date: 7/31/2026 |