|
Download Data (XLS File) |
|
|||||
|
|||||
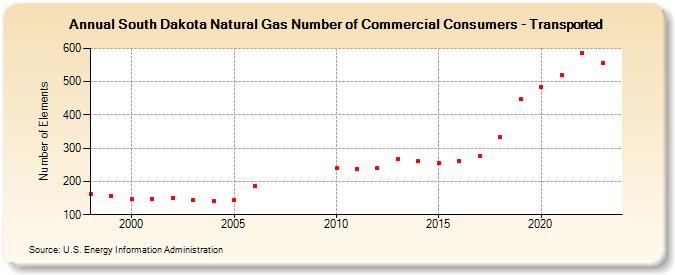
| South Dakota Natural Gas Number of Commercial Consumers - Transported (Number of Elements) | |||||
| Decade | Year-0 | Year-1 | Year-2 | Year-3 | Year-4 | Year-5 | Year-6 | Year-7 | Year-8 | Year-9 |
|---|---|---|---|---|---|---|---|---|---|---|
| 1990's | 163 | 157 | ||||||||
| 2000's | 147 | 147 | 151 | 144 | 140 | 145 | 186 | |||
| 2010's | 239 | 238 | 239 | 267 | 261 | 256 | 261 | 277 | 334 | 447 |
| 2020's | 484 | 521 | 586 | 556 | 541 |
| - = No Data Reported; -- = Not Applicable; NA = Not Available; W = Withheld to avoid disclosure of individual company data. |
| Release Date: 6/30/2026 |
| Next Release Date: 7/31/2026 |