|
Download Data (XLS File) |
|
|||||
|
|||||
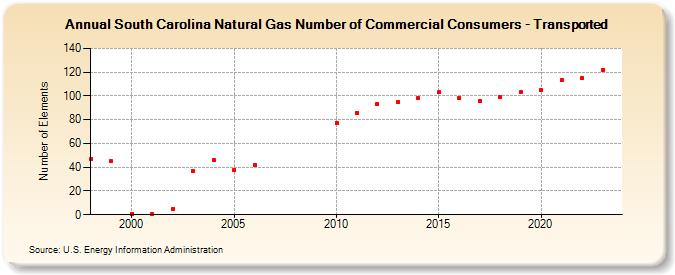
| South Carolina Natural Gas Number of Commercial Consumers - Transported (Number of Elements) | |||||
| Decade | Year-0 | Year-1 | Year-2 | Year-3 | Year-4 | Year-5 | Year-6 | Year-7 | Year-8 | Year-9 |
|---|---|---|---|---|---|---|---|---|---|---|
| 1990's | 47 | 45 | ||||||||
| 2000's | 1 | 1 | 5 | 37 | 46 | 38 | 42 | |||
| 2010's | 77 | 86 | 93 | 95 | 98 | 103 | 98 | 96 | 99 | 103 |
| 2020's | 105 | 113 | 115 | 122 | 179 |
| - = No Data Reported; -- = Not Applicable; NA = Not Available; W = Withheld to avoid disclosure of individual company data. |
| Release Date: 6/30/2026 |
| Next Release Date: 7/31/2026 |