|
Download Data (XLS File) |
|
|||||
|
|||||
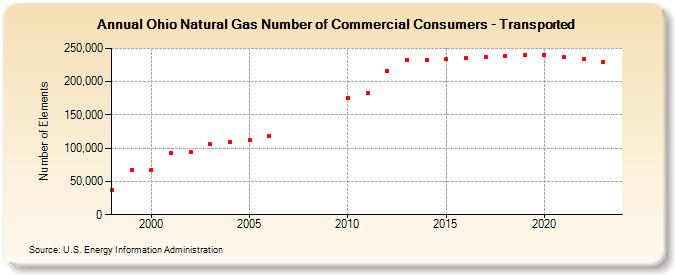
| Ohio Natural Gas Number of Commercial Consumers - Transported (Number of Elements) | |||||
| Decade | Year-0 | Year-1 | Year-2 | Year-3 | Year-4 | Year-5 | Year-6 | Year-7 | Year-8 | Year-9 |
|---|---|---|---|---|---|---|---|---|---|---|
| 1990's | 37,513 | 66,621 | ||||||||
| 2000's | 67,335 | 92,037 | 94,694 | 106,985 | 109,832 | 112,529 | 117,766 | |||
| 2010's | 175,725 | 182,770 | 216,485 | 233,115 | 232,723 | 233,369 | 235,860 | 237,419 | 238,690 | 239,333 |
| 2020's | 240,429 | 236,594 | 233,469 | 229,913 | 236,583 |
| - = No Data Reported; -- = Not Applicable; NA = Not Available; W = Withheld to avoid disclosure of individual company data. |
| Release Date: 6/30/2026 |
| Next Release Date: 7/31/2026 |