|
Download Data (XLS File) |
|
|||||
|
|||||
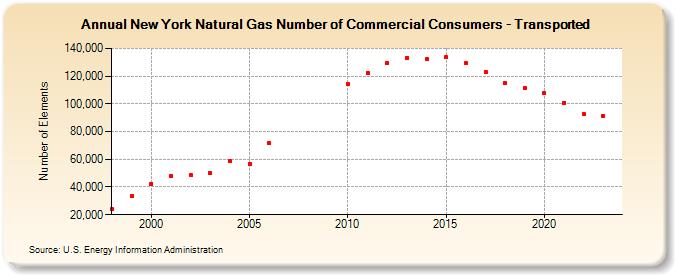
| New York Natural Gas Number of Commercial Consumers - Transported (Number of Elements) | |||||
| Decade | Year-0 | Year-1 | Year-2 | Year-3 | Year-4 | Year-5 | Year-6 | Year-7 | Year-8 | Year-9 |
|---|---|---|---|---|---|---|---|---|---|---|
| 1990's | 23,775 | 33,322 | ||||||||
| 2000's | 42,479 | 47,778 | 48,310 | 50,065 | 58,932 | 56,948 | 71,456 | |||
| 2010's | 114,064 | 122,545 | 129,295 | 133,282 | 132,514 | 133,495 | 129,104 | 123,260 | 115,021 | 111,399 |
| 2020's | 107,910 | 100,799 | 92,790 | 91,221 | 89,398 |
| - = No Data Reported; -- = Not Applicable; NA = Not Available; W = Withheld to avoid disclosure of individual company data. |
| Release Date: 6/30/2026 |
| Next Release Date: 7/31/2026 |