|
Download Data (XLS File) |
|
|||||
|
|||||
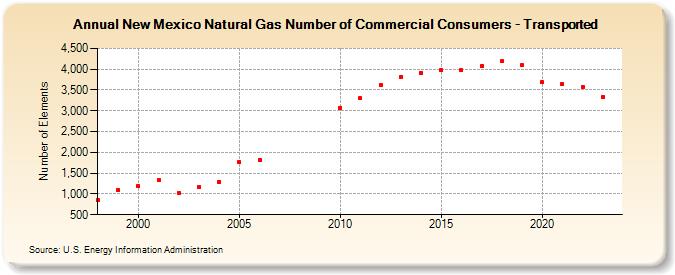
| New Mexico Natural Gas Number of Commercial Consumers - Transported (Number of Elements) | |||||
| Decade | Year-0 | Year-1 | Year-2 | Year-3 | Year-4 | Year-5 | Year-6 | Year-7 | Year-8 | Year-9 |
|---|---|---|---|---|---|---|---|---|---|---|
| 1990's | 857 | 1,094 | ||||||||
| 2000's | 1,187 | 1,330 | 1,020 | 1,169 | 1,284 | 1,766 | 1,827 | |||
| 2010's | 3,078 | 3,302 | 3,616 | 3,815 | 3,917 | 3,980 | 3,971 | 4,082 | 4,188 | 4,091 |
| 2020's | 3,683 | 3,645 | 3,583 | 3,329 | 3,315 |
| - = No Data Reported; -- = Not Applicable; NA = Not Available; W = Withheld to avoid disclosure of individual company data. |
| Release Date: 5/29/2026 |
| Next Release Date: 6/30/2026 |