|
Download Data (XLS File) |
|
|||||
|
|||||
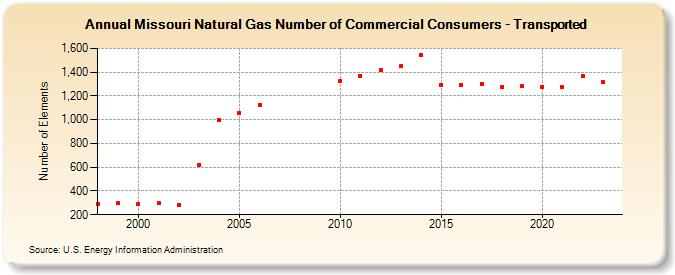
| Missouri Natural Gas Number of Commercial Consumers - Transported (Number of Elements) | |||||
| Decade | Year-0 | Year-1 | Year-2 | Year-3 | Year-4 | Year-5 | Year-6 | Year-7 | Year-8 | Year-9 |
|---|---|---|---|---|---|---|---|---|---|---|
| 1990's | 286 | 298 | ||||||||
| 2000's | 286 | 296 | 285 | 622 | 994 | 1,058 | 1,127 | |||
| 2010's | 1,328 | 1,371 | 1,419 | 1,448 | 1,547 | 1,295 | 1,293 | 1,303 | 1,278 | 1,284 |
| 2020's | 1,275 | 1,272 | 1,369 | 1,318 | 1,341 |
| - = No Data Reported; -- = Not Applicable; NA = Not Available; W = Withheld to avoid disclosure of individual company data. |
| Release Date: 6/30/2026 |
| Next Release Date: 7/31/2026 |