|
Download Data (XLS File) |
|
|||||
|
|||||
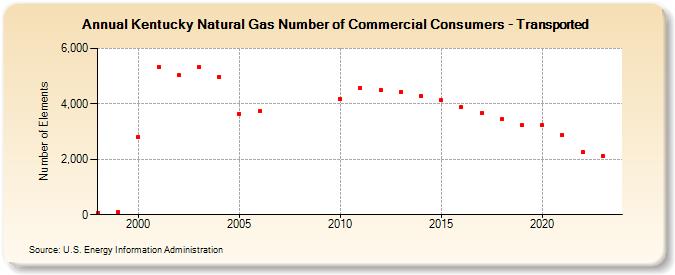
| Kentucky Natural Gas Number of Commercial Consumers - Transported (Number of Elements) | |||||
| Decade | Year-0 | Year-1 | Year-2 | Year-3 | Year-4 | Year-5 | Year-6 | Year-7 | Year-8 | Year-9 |
|---|---|---|---|---|---|---|---|---|---|---|
| 1990's | 79 | 87 | ||||||||
| 2000's | 2,808 | 5,338 | 5,029 | 5,336 | 4,982 | 3,643 | 3,729 | |||
| 2010's | 4,166 | 4,585 | 4,485 | 4,420 | 4,292 | 4,127 | 3,882 | 3,674 | 3,442 | 3,221 |
| 2020's | 3,230 | 2,884 | 2,252 | 2,132 | 2,060 |
| - = No Data Reported; -- = Not Applicable; NA = Not Available; W = Withheld to avoid disclosure of individual company data. |
| Release Date: 6/30/2026 |
| Next Release Date: 7/31/2026 |