|
Download Data (XLS File) |
|
|||||
|
|||||
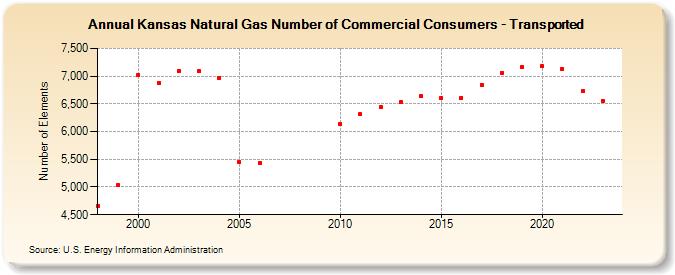
| Kansas Natural Gas Number of Commercial Consumers - Transported (Number of Elements) | |||||
| Decade | Year-0 | Year-1 | Year-2 | Year-3 | Year-4 | Year-5 | Year-6 | Year-7 | Year-8 | Year-9 |
|---|---|---|---|---|---|---|---|---|---|---|
| 1990's | 4,663 | 5,029 | ||||||||
| 2000's | 7,028 | 6,882 | 7,100 | 7,089 | 6,973 | 5,451 | 5,440 | |||
| 2010's | 6,136 | 6,315 | 6,443 | 6,528 | 6,636 | 6,606 | 6,612 | 6,841 | 7,063 | 7,165 |
| 2020's | 7,181 | 7,131 | 6,731 | 6,560 | 6,428 |
| - = No Data Reported; -- = Not Applicable; NA = Not Available; W = Withheld to avoid disclosure of individual company data. |
| Release Date: 6/30/2026 |
| Next Release Date: 7/31/2026 |