|
Download Data (XLS File) |
|
|||||
|
|||||
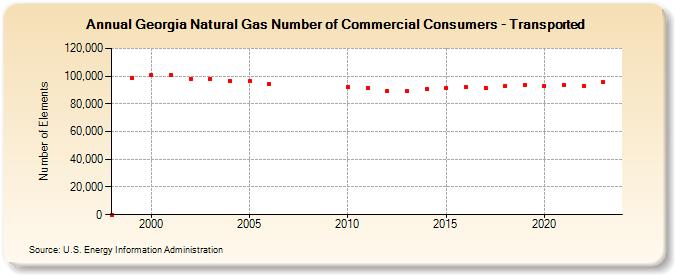
| Georgia Natural Gas Number of Commercial Consumers - Transported (Number of Elements) | |||||
| Decade | Year-0 | Year-1 | Year-2 | Year-3 | Year-4 | Year-5 | Year-6 | Year-7 | Year-8 | Year-9 |
|---|---|---|---|---|---|---|---|---|---|---|
| 1990's | 60 | 98,673 | ||||||||
| 2000's | 100,696 | 100,693 | 98,131 | 97,783 | 96,816 | 96,259 | 94,391 | |||
| 2010's | 92,441 | 91,292 | 89,488 | 89,504 | 90,728 | 91,457 | 91,999 | 91,783 | 92,905 | 93,702 |
| 2020's | 93,084 | 93,744 | 92,967 | 95,398 | 95,569 |
| - = No Data Reported; -- = Not Applicable; NA = Not Available; W = Withheld to avoid disclosure of individual company data. |
| Release Date: 6/30/2026 |
| Next Release Date: 7/31/2026 |