|
Download Data (XLS File) |
|
|||||
|
|||||
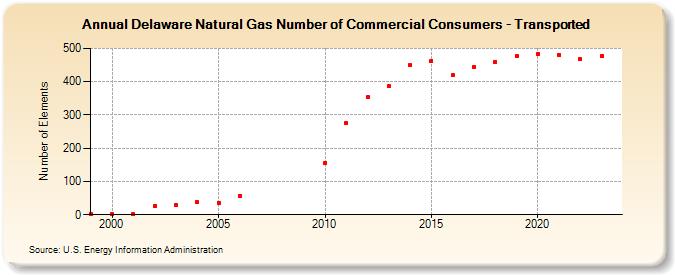
| Delaware Natural Gas Number of Commercial Consumers - Transported (Number of Elements) | |||||
| Decade | Year-0 | Year-1 | Year-2 | Year-3 | Year-4 | Year-5 | Year-6 | Year-7 | Year-8 | Year-9 |
|---|---|---|---|---|---|---|---|---|---|---|
| 1990's | 1 | |||||||||
| 2000's | 1 | 1 | 26 | 28 | 37 | 36 | 57 | |||
| 2010's | 155 | 275 | 353 | 386 | 450 | 463 | 420 | 445 | 460 | 476 |
| 2020's | 484 | 481 | 468 | 478 | 483 |
| - = No Data Reported; -- = Not Applicable; NA = Not Available; W = Withheld to avoid disclosure of individual company data. |
| Release Date: 6/30/2026 |
| Next Release Date: 7/31/2026 |