|
Download Data (XLS File) |
|
|||||
|
|||||
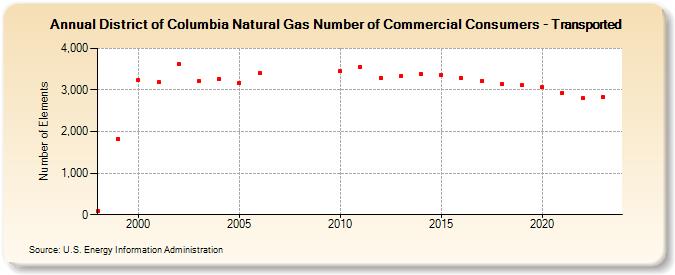
| District of Columbia Natural Gas Number of Commercial Consumers - Transported (Number of Elements) | |||||
| Decade | Year-0 | Year-1 | Year-2 | Year-3 | Year-4 | Year-5 | Year-6 | Year-7 | Year-8 | Year-9 |
|---|---|---|---|---|---|---|---|---|---|---|
| 1990's | 78 | 1,825 | ||||||||
| 2000's | 3,234 | 3,181 | 3,623 | 3,215 | 3,268 | 3,177 | 3,406 | |||
| 2010's | 3,450 | 3,556 | 3,293 | 3,327 | 3,384 | 3,363 | 3,286 | 3,222 | 3,142 | 3,110 |
| 2020's | 3,061 | 2,939 | 2,798 | 2,819 | 2,925 |
| - = No Data Reported; -- = Not Applicable; NA = Not Available; W = Withheld to avoid disclosure of individual company data. |
| Release Date: 6/30/2026 |
| Next Release Date: 7/31/2026 |