|
Download Data (XLS File) |
|
|||||
|
|||||
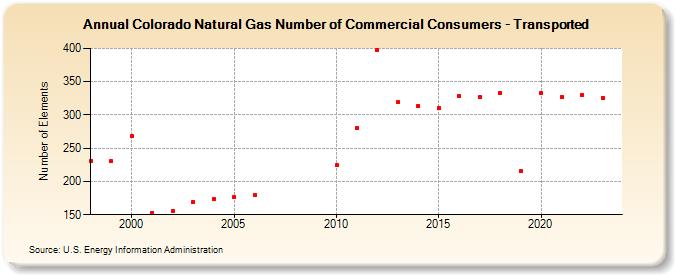
| Colorado Natural Gas Number of Commercial Consumers - Transported (Number of Elements) | |||||
| Decade | Year-0 | Year-1 | Year-2 | Year-3 | Year-4 | Year-5 | Year-6 | Year-7 | Year-8 | Year-9 |
|---|---|---|---|---|---|---|---|---|---|---|
| 1990's | 231 | 230 | ||||||||
| 2000's | 268 | 153 | 156 | 169 | 173 | 176 | 180 | |||
| 2010's | 224 | 280 | 397 | 319 | 314 | 310 | 328 | 327 | 333 | 215 |
| 2020's | 333 | 327 | 330 | 326 | 316 |
| - = No Data Reported; -- = Not Applicable; NA = Not Available; W = Withheld to avoid disclosure of individual company data. |
| Release Date: 6/30/2026 |
| Next Release Date: 7/31/2026 |