|
Download Data (XLS File) |
|
|||||
|
|||||
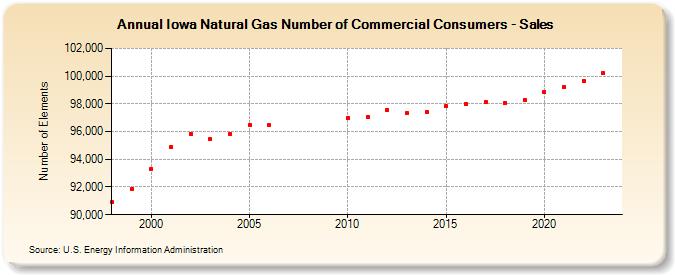
| Iowa Natural Gas Number of Commercial Consumers - Sales (Number of Elements) | |||||
| Decade | Year-0 | Year-1 | Year-2 | Year-3 | Year-4 | Year-5 | Year-6 | Year-7 | Year-8 | Year-9 |
|---|---|---|---|---|---|---|---|---|---|---|
| 1990's | 90,896 | 91,886 | ||||||||
| 2000's | 93,299 | 94,892 | 95,829 | 95,455 | 95,839 | 96,494 | 96,441 | |||
| 2010's | 96,996 | 97,075 | 97,580 | 97,334 | 97,413 | 97,831 | 98,011 | 98,098 | 98,056 | 98,302 |
| 2020's | 98,870 | 99,208 | 99,675 | 100,206 | 100,949 |
| - = No Data Reported; -- = Not Applicable; NA = Not Available; W = Withheld to avoid disclosure of individual company data. |
| Release Date: 6/30/2026 |
| Next Release Date: 7/31/2026 |