|
Download Data (XLS File) |
|
|||||
|
|||||
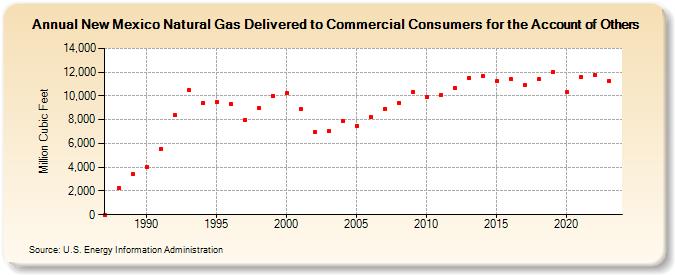
| New Mexico Natural Gas Delivered to Commercial Consumers for the Account of Others (Million Cubic Feet) | |||||
| Decade | Year-0 | Year-1 | Year-2 | Year-3 | Year-4 | Year-5 | Year-6 | Year-7 | Year-8 | Year-9 |
|---|---|---|---|---|---|---|---|---|---|---|
| 1980's | 0 | 2,280 | 3,386 | |||||||
| 1990's | 4,008 | 5,570 | 8,361 | 10,459 | 9,395 | 9,520 | 9,351 | 7,959 | 8,981 | 10,033 |
| 2000's | 10,212 | 8,878 | 6,993 | 7,055 | 7,903 | 7,501 | 8,195 | 8,901 | 9,425 | 10,328 |
| 2010's | 9,875 | 10,062 | 10,698 | 11,511 | 11,704 | 11,219 | 11,395 | 10,878 | 11,383 | 12,022 |
| 2020's | 10,343 | 11,571 | 11,767 | 11,294 | 10,347 |
| - = No Data Reported; -- = Not Applicable; NA = Not Available; W = Withheld to avoid disclosure of individual company data. |
| Release Date: 6/30/2026 |
| Next Release Date: 7/31/2026 |