|
Download Data (XLS File) |
|
|||||
|
|||||
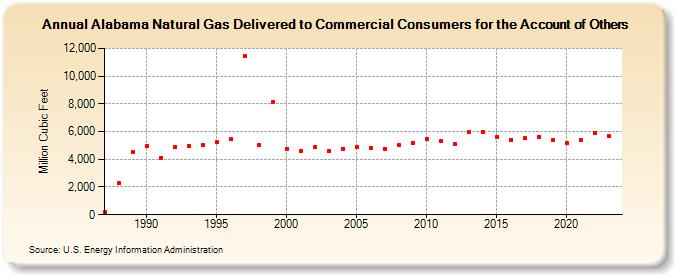
| Alabama Natural Gas Delivered to Commercial Consumers for the Account of Others (Million Cubic Feet) | |||||
| Decade | Year-0 | Year-1 | Year-2 | Year-3 | Year-4 | Year-5 | Year-6 | Year-7 | Year-8 | Year-9 |
|---|---|---|---|---|---|---|---|---|---|---|
| 1980's | 173 | 2,278 | 4,498 | |||||||
| 1990's | 4,967 | 4,112 | 4,868 | 4,950 | 5,043 | 5,213 | 5,470 | 11,432 | 5,009 | 8,141 |
| 2000's | 4,753 | 4,608 | 4,882 | 4,604 | 4,744 | 4,891 | 4,832 | 4,722 | 4,999 | 5,160 |
| 2010's | 5,494 | 5,313 | 5,126 | 5,935 | 5,941 | 5,618 | 5,376 | 5,506 | 5,629 | 5,355 |
| 2020's | 5,151 | 5,410 | 5,924 | 5,684 | 5,805 |
| - = No Data Reported; -- = Not Applicable; NA = Not Available; W = Withheld to avoid disclosure of individual company data. |
| Release Date: 6/30/2026 |
| Next Release Date: 7/31/2026 |