|
Download Data (XLS File) |
|
|||||
|
|||||
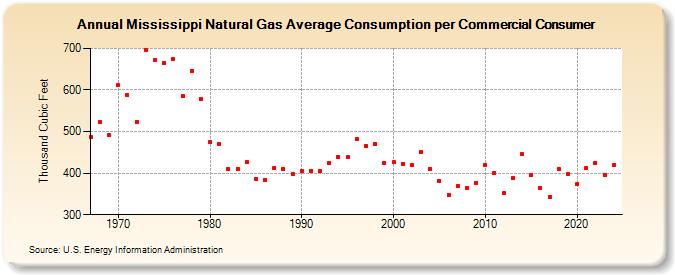
| Mississippi Natural Gas Average Consumption per Commercial Consumer (Thousand Cubic Feet) | |||||
| Decade | Year-0 | Year-1 | Year-2 | Year-3 | Year-4 | Year-5 | Year-6 | Year-7 | Year-8 | Year-9 |
|---|---|---|---|---|---|---|---|---|---|---|
| 1960's | 487 | 523 | 491 | |||||||
| 1970's | 611 | 588 | 523 | 697 | 671 | 665 | 674 | 585 | 646 | 579 |
| 1980's | 475 | 470 | 410 | 411 | 426 | 386 | 384 | 413 | 410 | 397 |
| 1990's | 406 | 406 | 405 | 424 | 439 | 438 | 483 | 466 | 471 | 424 |
| 2000's | 426 | 422 | 420 | 450 | 410 | 380 | 348 | 370 | 365 | 377 |
| 2010's | 419 | 400 | 352 | 388 | 445 | 396 | 365 | 343 | 410 | 399 |
| 2020's | 373 | 412 | 425 | 396 | 419 |
| - = No Data Reported; -- = Not Applicable; NA = Not Available; W = Withheld to avoid disclosure of individual company data. |
| Release Date: 6/30/2026 |
| Next Release Date: 7/31/2026 |