|
Download Data (XLS File) |
|
|||||
|
|||||
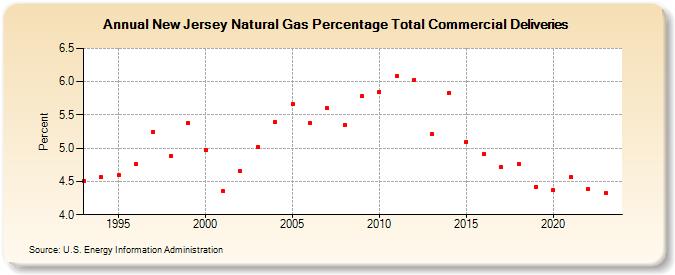
| New Jersey Natural Gas Percentage Total Commercial Deliveries (Percent) | |||||
| Decade | Year-0 | Year-1 | Year-2 | Year-3 | Year-4 | Year-5 | Year-6 | Year-7 | Year-8 | Year-9 |
|---|---|---|---|---|---|---|---|---|---|---|
| 1990's | 4.51 | 4.56 | 4.59 | 4.76 | 5.25 | 4.89 | 5.38 | |||
| 2000's | 4.98 | 4.35 | 4.65 | 5.02 | 5.39 | 5.66 | 5.38 | 5.60 | 5.35 | 5.78 |
| 2010's | 5.85 | 6.08 | 6.03 | 5.21 | 5.83 | 5.10 | 4.92 | 4.71 | 4.76 | 4.42 |
| 2020's | 4.37 | 4.56 | 4.38 | 4.35 | 4.31 |
| - = No Data Reported; -- = Not Applicable; NA = Not Available; W = Withheld to avoid disclosure of individual company data. |
| Release Date: 5/29/2026 |
| Next Release Date: 6/30/2026 |