|
Download Data (XLS File) |
|
|||||
|
|||||
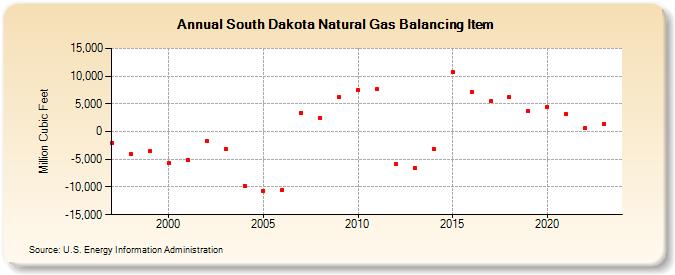
| South Dakota Natural Gas Balancing Item (Million Cubic Feet) | |||||
| Decade | Year-0 | Year-1 | Year-2 | Year-3 | Year-4 | Year-5 | Year-6 | Year-7 | Year-8 | Year-9 |
|---|---|---|---|---|---|---|---|---|---|---|
| 1990's | -2,000 | -3,980 | -3,561 | |||||||
| 2000's | -5,707 | -5,122 | -1,781 | -3,186 | -9,754 | -10,661 | -10,482 | 3,415 | 2,500 | 6,211 |
| 2010's | 7,522 | 7,603 | -5,918 | -6,520 | -3,175 | 10,756 | 7,174 | 5,446 | 6,200 | 3,634 |
| 2020's | 4,406 | 3,161 | 552 | 3,229 | 1,946 |
| - = No Data Reported; -- = Not Applicable; NA = Not Available; W = Withheld to avoid disclosure of individual company data. |
| Release Date: 6/30/2026 |
| Next Release Date: 7/31/2026 |