|
Download Data (XLS File) |
|
|||||
|
|||||
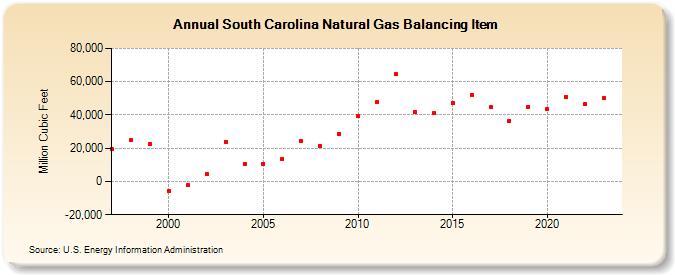
| South Carolina Natural Gas Balancing Item (Million Cubic Feet) | |||||
| Decade | Year-0 | Year-1 | Year-2 | Year-3 | Year-4 | Year-5 | Year-6 | Year-7 | Year-8 | Year-9 |
|---|---|---|---|---|---|---|---|---|---|---|
| 1990's | 19,244 | 24,713 | 22,581 | |||||||
| 2000's | -5,558 | -1,989 | 4,366 | 23,923 | 10,353 | 10,665 | 13,735 | 24,170 | 21,366 | 28,668 |
| 2010's | 39,418 | 47,760 | 64,321 | 41,802 | 41,028 | 46,902 | 52,204 | 44,680 | 36,565 | 45,058 |
| 2020's | 43,652 | 51,031 | 46,373 | 45,499 | 43,140 |
| - = No Data Reported; -- = Not Applicable; NA = Not Available; W = Withheld to avoid disclosure of individual company data. |
| Release Date: 6/30/2026 |
| Next Release Date: 7/31/2026 |