|
Download Data (XLS File) |
|
|||||
|
|||||
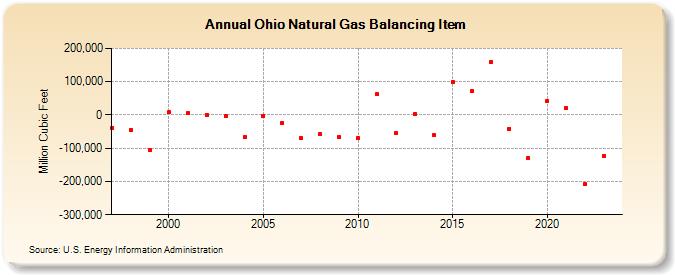
| Ohio Natural Gas Balancing Item (Million Cubic Feet) | |||||
| Decade | Year-0 | Year-1 | Year-2 | Year-3 | Year-4 | Year-5 | Year-6 | Year-7 | Year-8 | Year-9 |
|---|---|---|---|---|---|---|---|---|---|---|
| 1990's | -39,324 | -44,871 | -104,348 | |||||||
| 2000's | 7,861 | 6,051 | -186 | -3,160 | -67,071 | -2,244 | -23,831 | -70,221 | -57,457 | -65,751 |
| 2010's | -69,213 | 62,091 | -55,286 | 3,638 | -61,306 | 99,655 | 71,121 | 158,057 | -41,184 | -129,060 |
| 2020's | 42,271 | 20,326 | -208,609 | -125,086 | -75,157 |
| - = No Data Reported; -- = Not Applicable; NA = Not Available; W = Withheld to avoid disclosure of individual company data. |
| Release Date: 6/30/2026 |
| Next Release Date: 7/31/2026 |