|
Download Data (XLS File) |
|
|||||
|
|||||
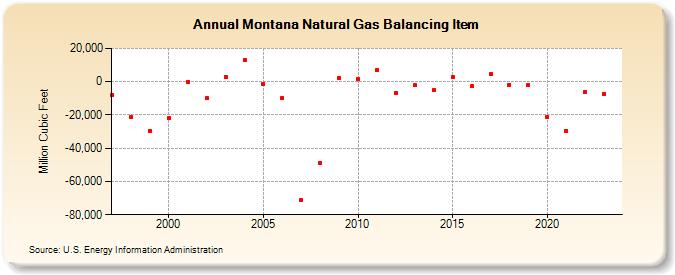
| Montana Natural Gas Balancing Item (Million Cubic Feet) | |||||
| Decade | Year-0 | Year-1 | Year-2 | Year-3 | Year-4 | Year-5 | Year-6 | Year-7 | Year-8 | Year-9 |
|---|---|---|---|---|---|---|---|---|---|---|
| 1990's | -8,248 | -21,311 | -29,591 | |||||||
| 2000's | -21,944 | -40 | -10,001 | 2,711 | 13,235 | -1,423 | -10,005 | -71,123 | -48,974 | 1,936 |
| 2010's | 1,635 | 6,915 | -6,711 | -2,163 | -4,962 | 2,837 | -2,820 | 4,578 | -1,778 | -2,014 |
| 2020's | -21,441 | -29,416 | -6,124 | -7,732 | 2,722 |
| - = No Data Reported; -- = Not Applicable; NA = Not Available; W = Withheld to avoid disclosure of individual company data. |
| Release Date: 6/30/2026 |
| Next Release Date: 7/31/2026 |