|
Download Data (XLS File) |
|
|||||
|
|||||
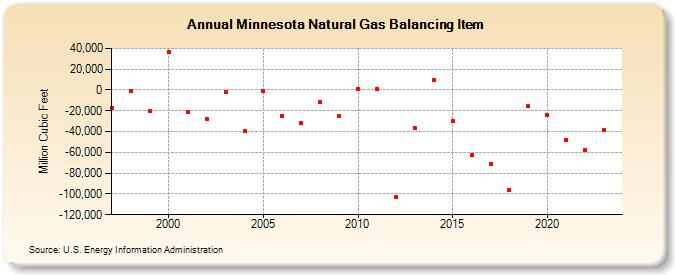
| Minnesota Natural Gas Balancing Item (Million Cubic Feet) | |||||
| Decade | Year-0 | Year-1 | Year-2 | Year-3 | Year-4 | Year-5 | Year-6 | Year-7 | Year-8 | Year-9 |
|---|---|---|---|---|---|---|---|---|---|---|
| 1990's | -17,094 | -564 | -20,536 | |||||||
| 2000's | 36,990 | -21,218 | -27,744 | -1,620 | -39,217 | -1,316 | -25,035 | -31,856 | -11,496 | -25,383 |
| 2010's | 1,371 | 1,310 | -102,552 | -36,481 | 9,143 | -29,969 | -62,223 | -70,819 | -95,876 | -15,868 |
| 2020's | -24,033 | -47,677 | -57,509 | -38,895 | -51,949 |
| - = No Data Reported; -- = Not Applicable; NA = Not Available; W = Withheld to avoid disclosure of individual company data. |
| Release Date: 6/30/2026 |
| Next Release Date: 7/31/2026 |