|
Download Data (XLS File) |
|
|||||
|
|||||
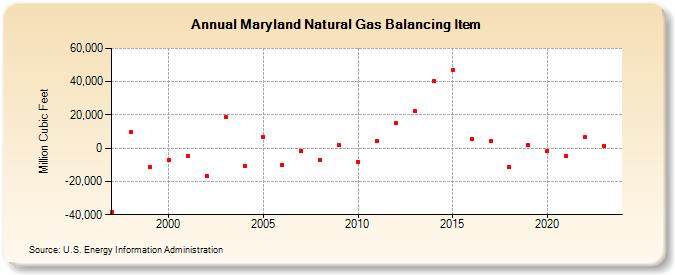
| Maryland Natural Gas Balancing Item (Million Cubic Feet) | |||||
| Decade | Year-0 | Year-1 | Year-2 | Year-3 | Year-4 | Year-5 | Year-6 | Year-7 | Year-8 | Year-9 |
|---|---|---|---|---|---|---|---|---|---|---|
| 1990's | -38,304 | 9,617 | -11,066 | |||||||
| 2000's | -7,052 | -4,889 | -16,526 | 18,619 | -10,518 | 6,790 | -9,919 | -1,817 | -7,046 | 1,918 |
| 2010's | -8,026 | 4,117 | 15,210 | 22,403 | 40,375 | 47,094 | 5,702 | 4,297 | -11,023 | 1,894 |
| 2020's | -1,582 | -4,710 | 6,575 | 2,527 | 8,474 |
| - = No Data Reported; -- = Not Applicable; NA = Not Available; W = Withheld to avoid disclosure of individual company data. |
| Release Date: 6/30/2026 |
| Next Release Date: 7/31/2026 |