|
Download Data (XLS File) |
|
|||||
|
|||||
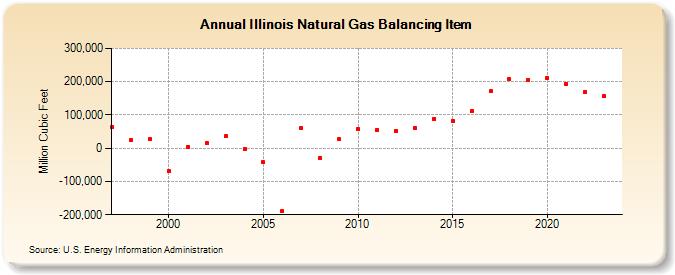
| Illinois Natural Gas Balancing Item (Million Cubic Feet) | |||||
| Decade | Year-0 | Year-1 | Year-2 | Year-3 | Year-4 | Year-5 | Year-6 | Year-7 | Year-8 | Year-9 |
|---|---|---|---|---|---|---|---|---|---|---|
| 1990's | 62,607 | 23,314 | 27,000 | |||||||
| 2000's | -69,786 | 4,699 | 14,353 | 35,190 | -1,965 | -42,413 | -189,689 | 60,587 | -29,256 | 26,178 |
| 2010's | 57,485 | 54,774 | 52,727 | 61,905 | 88,321 | 81,885 | 110,347 | 171,094 | 207,223 | 204,356 |
| 2020's | 209,798 | 194,251 | 168,835 | 148,523 | 145,665 |
| - = No Data Reported; -- = Not Applicable; NA = Not Available; W = Withheld to avoid disclosure of individual company data. |
| Release Date: 6/30/2026 |
| Next Release Date: 7/31/2026 |