|
Download Data (XLS File) |
|
|||||
|
|||||
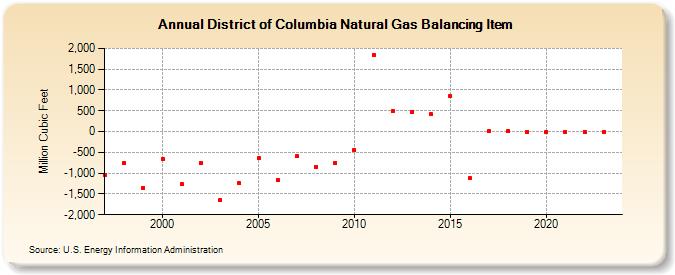
| District of Columbia Natural Gas Balancing Item (Million Cubic Feet) | |||||
| Decade | Year-0 | Year-1 | Year-2 | Year-3 | Year-4 | Year-5 | Year-6 | Year-7 | Year-8 | Year-9 |
|---|---|---|---|---|---|---|---|---|---|---|
| 1990's | -1,038 | -755 | -1,354 | |||||||
| 2000's | -652 | -1,266 | -749 | -1,652 | -1,244 | -642 | -1,166 | -599 | -843 | -751 |
| 2010's | -446 | 1,846 | 486 | 480 | 412 | 858 | -1,125 | 6 | 13 | 0 |
| 2020's | 0 | 0 | 0 | 0 | 0 |
| - = No Data Reported; -- = Not Applicable; NA = Not Available; W = Withheld to avoid disclosure of individual company data. |
| Release Date: 6/30/2026 |
| Next Release Date: 7/31/2026 |