|
Download Data (XLS File) |
|
|||||
|
|||||
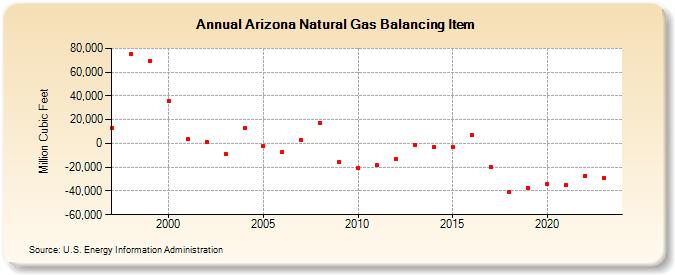
| Arizona Natural Gas Balancing Item (Million Cubic Feet) | |||||
| Decade | Year-0 | Year-1 | Year-2 | Year-3 | Year-4 | Year-5 | Year-6 | Year-7 | Year-8 | Year-9 |
|---|---|---|---|---|---|---|---|---|---|---|
| 1990's | 12,938 | 75,220 | 69,377 | |||||||
| 2000's | 35,889 | 3,394 | 1,505 | -8,566 | 12,941 | -2,238 | -6,821 | 3,165 | 17,478 | -15,825 |
| 2010's | -20,750 | -18,162 | -13,246 | -1,351 | -2,926 | -3,418 | 7,413 | -19,505 | -40,844 | -37,214 |
| 2020's | -34,011 | -35,060 | -27,051 | -28,738 | -18,846 |
| - = No Data Reported; -- = Not Applicable; NA = Not Available; W = Withheld to avoid disclosure of individual company data. |
| Release Date: 6/30/2026 |
| Next Release Date: 7/31/2026 |