|
Download Data (XLS File) |
|
|||||
|
|||||
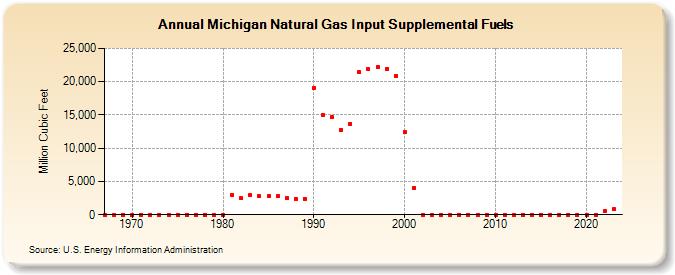
| Michigan Natural Gas Input Supplemental Fuels (Million Cubic Feet) | |||||
| Decade | Year-0 | Year-1 | Year-2 | Year-3 | Year-4 | Year-5 | Year-6 | Year-7 | Year-8 | Year-9 |
|---|---|---|---|---|---|---|---|---|---|---|
| 1960's | 0 | 0 | 0 | |||||||
| 1970's | 0 | 0 | 0 | 0 | 0 | 0 | 0 | 0 | 0 | 0 |
| 1980's | 3 | 3,038 | 2,473 | 2,956 | 2,773 | 2,789 | 2,754 | 2,483 | 2,402 | 2,402 |
| 1990's | 19,106 | 15,016 | 14,694 | 12,795 | 13,688 | 21,378 | 21,848 | 22,238 | 21,967 | 20,896 |
| 2000's | 12,423 | 4,054 | 0 | 0 | 0 | 0 | 0 | 0 | 0 | 0 |
| 2010's | 0 | 0 | 0 | 0 | 0 | 0 | 0 | 0 | 0 | 0 |
| 2020's | 0 | 0 | 542 | 1,309 | 1,475 |
| - = No Data Reported; -- = Not Applicable; NA = Not Available; W = Withheld to avoid disclosure of individual company data. |
| Release Date: 6/30/2026 |
| Next Release Date: 7/31/2026 |