|
Download Data (XLS File) |
|
|||||
|
|||||
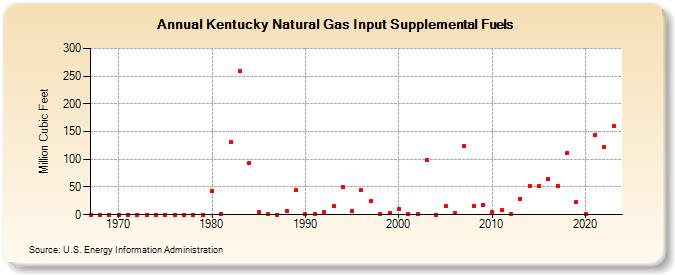
| Kentucky Natural Gas Input Supplemental Fuels (Million Cubic Feet) | |||||
| Decade | Year-0 | Year-1 | Year-2 | Year-3 | Year-4 | Year-5 | Year-6 | Year-7 | Year-8 | Year-9 |
|---|---|---|---|---|---|---|---|---|---|---|
| 1960's | 0 | 0 | 0 | |||||||
| 1970's | 0 | 0 | 0 | 0 | 0 | 0 | 0 | 0 | 0 | 0 |
| 1980's | 42 | 2 | 131 | 259 | 94 | 4 | 1 | 0 | 6 | 44 |
| 1990's | 2 | 2 | 5 | 16 | 50 | 6 | 45 | 24 | 2 | 3 |
| 2000's | 10 | 2 | 1 | 98 | 0 | 15 | 3 | 124 | 15 | 18 |
| 2010's | 5 | 8 | 1 | 29 | 52 | 51 | 65 | 51 | 111 | 23 |
| 2020's | 2 | 144 | 122 | 214 | 144 |
| - = No Data Reported; -- = Not Applicable; NA = Not Available; W = Withheld to avoid disclosure of individual company data. |
| Release Date: 6/30/2026 |
| Next Release Date: 7/31/2026 |