|
Download Data (XLS File) |
|
|||||
|
|||||
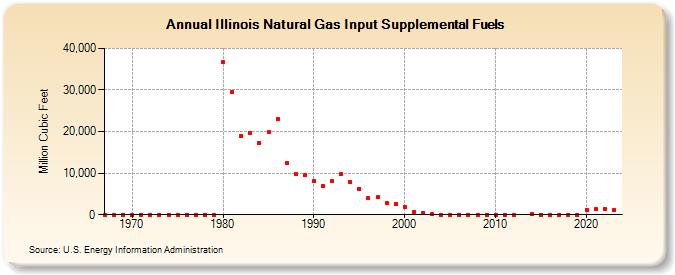
| Illinois Natural Gas Input Supplemental Fuels (Million Cubic Feet) | |||||
| Decade | Year-0 | Year-1 | Year-2 | Year-3 | Year-4 | Year-5 | Year-6 | Year-7 | Year-8 | Year-9 |
|---|---|---|---|---|---|---|---|---|---|---|
| 1960's | 0 | 0 | 0 | |||||||
| 1970's | 0 | 0 | 0 | 0 | 0 | 0 | 0 | 0 | 0 | 0 |
| 1980's | 36,713 | 29,509 | 19,005 | 19,734 | 17,308 | 19,805 | 22,980 | 12,514 | 9,803 | 9,477 |
| 1990's | 8,140 | 6,869 | 8,042 | 9,760 | 7,871 | 6,256 | 3,912 | 4,165 | 2,736 | 2,527 |
| 2000's | 1,955 | 763 | 456 | 52 | 14 | 15 | 13 | 11 | 15 | 20 |
| 2010's | 17 | 1 | 1 | 63 | 1 | 2 | 2 | 2 | 5 | |
| 2020's | 1,245 | 1,287 | 1,398 | 1,217 | 1,214 |
| - = No Data Reported; -- = Not Applicable; NA = Not Available; W = Withheld to avoid disclosure of individual company data. |
| Release Date: 6/30/2026 |
| Next Release Date: 7/31/2026 |