|
Download Data (XLS File) |
|
|||||
|
|||||
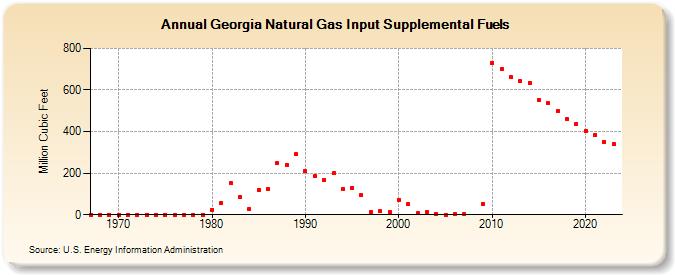
| Georgia Natural Gas Input Supplemental Fuels (Million Cubic Feet) | |||||
| Decade | Year-0 | Year-1 | Year-2 | Year-3 | Year-4 | Year-5 | Year-6 | Year-7 | Year-8 | Year-9 |
|---|---|---|---|---|---|---|---|---|---|---|
| 1960's | 0 | 0 | 0 | |||||||
| 1970's | 0 | 0 | 0 | 0 | 0 | 0 | 0 | 0 | 0 | 0 |
| 1980's | 24 | 57 | 151 | 84 | 28 | 121 | 124 | 248 | 241 | 292 |
| 1990's | 209 | 185 | 166 | 199 | 123 | 130 | 94 | 14 | 16 | 12 |
| 2000's | 73 | 51 | 7 | 14 | 5 | 0 | 3 | 2 | 52 | |
| 2010's | 732 | 701 | 660 | 642 | 635 | 554 | 536 | 500 | 460 | 437 |
| 2020's | 405 | 383 | 352 | 341 | 332 |
| - = No Data Reported; -- = Not Applicable; NA = Not Available; W = Withheld to avoid disclosure of individual company data. |
| Release Date: 6/30/2026 |
| Next Release Date: 7/31/2026 |