|
Download Data (XLS File) |
|
|||||
|
|||||
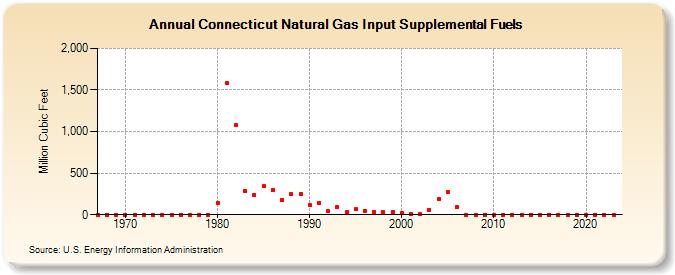
| Connecticut Natural Gas Input Supplemental Fuels (Million Cubic Feet) | |||||
| Decade | Year-0 | Year-1 | Year-2 | Year-3 | Year-4 | Year-5 | Year-6 | Year-7 | Year-8 | Year-9 |
|---|---|---|---|---|---|---|---|---|---|---|
| 1960's | 0 | 0 | 0 | |||||||
| 1970's | 0 | 0 | 0 | 0 | 0 | 0 | 0 | 0 | 0 | 0 |
| 1980's | 144 | 1,584 | 1,077 | 291 | 239 | 343 | 298 | 180 | 245 | 251 |
| 1990's | 111 | 146 | 40 | 94 | 29 | 68 | 48 | 37 | 33 | 31 |
| 2000's | 20 | 6 | 6 | 57 | 191 | 273 | 91 | 0 | 0 | 1 |
| 2010's | 0 | 0 | 0 | 0 | 0 | 0 | 0 | 0 | 0 | 0 |
| 2020's | 0 | 0 | 0 | 0 | 0 |
| - = No Data Reported; -- = Not Applicable; NA = Not Available; W = Withheld to avoid disclosure of individual company data. |
| Release Date: 6/30/2026 |
| Next Release Date: 7/31/2026 |