|
Download Data (XLS File) |
|
|||||
|
|||||
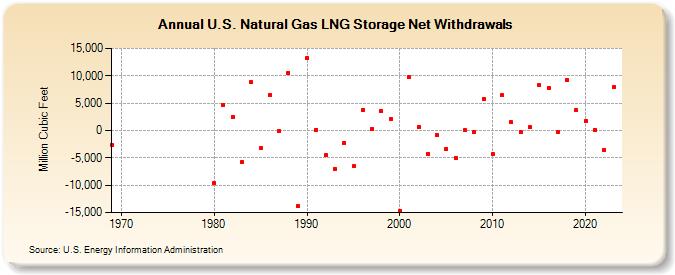
| U.S. Natural Gas LNG Storage Net Withdrawals (Million Cubic Feet) | |||||
| Decade | Year-0 | Year-1 | Year-2 | Year-3 | Year-4 | Year-5 | Year-6 | Year-7 | Year-8 | Year-9 |
|---|---|---|---|---|---|---|---|---|---|---|
| 1960's | -2,581 | |||||||||
| 1980's | -9,651 | 4,687 | 2,488 | -5,699 | 8,780 | -3,283 | 6,504 | -89 | 10,559 | -13,807 |
| 1990's | 13,271 | 169 | -4,501 | -6,972 | -2,211 | -6,549 | 3,770 | 348 | 3,522 | 2,154 |
| 2000's | -14,644 | 9,740 | 707 | -4,213 | -834 | -3,405 | -4,958 | 14 | -302 | 5,797 |
| 2010's | -4,282 | 6,424 | 1,491 | -309 | 559 | 8,251 | 7,793 | -256 | 9,248 | 3,715 |
| 2020's | 1,718 | 156 | -3,527 | 8,772 | -965 |
| - = No Data Reported; -- = Not Applicable; NA = Not Available; W = Withheld to avoid disclosure of individual company data. |
| Release Date: 6/30/2026 |
| Next Release Date: 7/31/2026 |