|
Download Data (XLS File) |
|
||||||||
|
||||||||
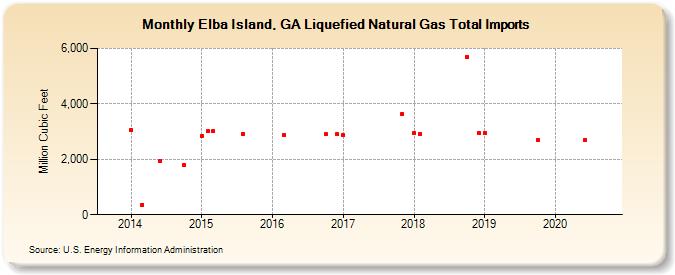
| Elba Island, GA Liquefied Natural Gas Total Imports (Million Cubic Feet) | ||||||||
| Year | Jan | Feb | Mar | Apr | May | Jun | Jul | Aug | Sep | Oct | Nov | Dec |
|---|---|---|---|---|---|---|---|---|---|---|---|---|
| 2014 | 3,066 | 367 | 1,939 | 1,784 | ||||||||
| 2015 | 2,847 | 3,010 | 3,004 | 2,925 | ||||||||
| 2016 | 2,877 | 2,897 | 2,899 | |||||||||
| 2017 | 2,868 | 3,646 | ||||||||||
| 2018 | 2,948 | 2,920 | 5,696 | 2,936 | ||||||||
| 2019 | 2,952 | 2,697 | ||||||||||
| 2020 | 2,693 | |||||||||||
| 2026 | 3,401 | |||||||||||
| - = No Data Reported; -- = Not Applicable; NA = Not Available; W = Withheld to avoid disclosure of individual company data. |
| Release Date: 5/29/2026 |
| Next Release Date: 6/30/2026 |