|
Download Data (XLS File) |
|
||||||||
|
||||||||
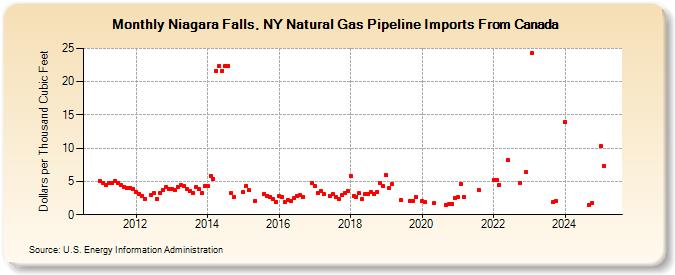
| Niagara Falls, NY Natural Gas Pipeline Imports From Canada (Dollars per Thousand Cubic Feet) | ||||||||
| Year | Jan | Feb | Mar | Apr | May | Jun | Jul | Aug | Sep | Oct | Nov | Dec |
|---|---|---|---|---|---|---|---|---|---|---|---|---|
| 2011 | 5.02 | 4.80 | 4.46 | 4.75 | 4.72 | 5.03 | 4.80 | 4.49 | 4.24 | 3.98 | 4.05 | 3.87 |
| 2012 | 3.46 | 3.13 | 2.81 | 2.38 | 2.97 | 3.26 | 2.43 | 3.22 | 3.66 | 4.18 | 3.85 | |
| 2013 | 3.89 | 3.75 | 4.21 | 4.46 | 4.38 | 3.86 | 3.57 | 3.33 | 4.12 | 3.91 | 3.24 | 4.26 |
| 2014 | 4.28 | 5.86 | 5.38 | 21.67 | 22.33 | 21.67 | 22.33 | 22.33 | 3.24 | 2.68 | ||
| 2015 | 3.45 | 4.36 | 3.65 | 2.08 | 3.14 | 2.85 | 2.73 | 2.31 | 1.97 | |||
| 2016 | 2.78 | 2.63 | 1.92 | 2.21 | 2.06 | 2.45 | 2.81 | 2.92 | 2.73 | 4.72 | ||
| 2017 | 4.28 | 3.24 | 3.55 | 3.06 | 2.84 | 3.13 | 2.70 | 2.31 | 2.92 | 3.33 | 3.58 | |
| 2018 | 5.82 | 2.88 | 2.71 | 3.21 | 2.38 | 3.14 | 3.04 | 3.37 | 3.11 | 3.43 | 4.80 | 4.28 |
| 2019 | 5.96 | 4.00 | 4.59 | 2.14 | 2.04 | 2.11 | 2.72 | |||||
| 2020 | 2.02 | 1.86 | 1.72 | 1.49 | 1.54 | 1.65 | 2.49 | |||||
| 2021 | 2.59 | 4.64 | 2.73 | 3.76 | ||||||||
| 2022 | 5.19 | 5.23 | 4.48 | 8.17 | 4.81 | 6.36 | ||||||
| 2023 | 24.33 | 1.85 | 2.05 | |||||||||
| 2024 | 13.99 | 1.44 | 1.72 | |||||||||
| 2025 | 10.26 | 7.29 | 4.85 | |||||||||
| 2026 | 29.87 | 6.57 | ||||||||||
| - = No Data Reported; -- = Not Applicable; NA = Not Available; W = Withheld to avoid disclosure of individual company data. |
| Release Date: 6/30/2026 |
| Next Release Date: 7/31/2026 |