|
Download Data (XLS File) |
|
||||||||
|
||||||||
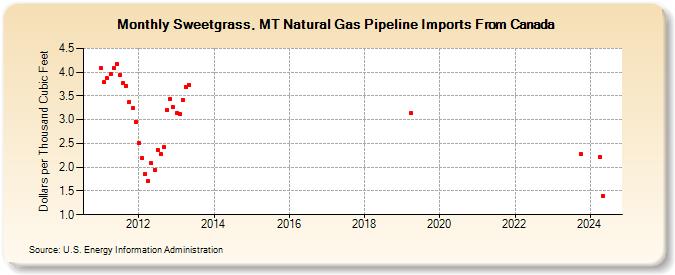
| Sweetgrass, MT Natural Gas Pipeline Imports From Canada (Dollars per Thousand Cubic Feet) | ||||||||
| Year | Jan | Feb | Mar | Apr | May | Jun | Jul | Aug | Sep | Oct | Nov | Dec |
|---|---|---|---|---|---|---|---|---|---|---|---|---|
| 2011 | 4.08 | 3.79 | 3.87 | 3.96 | 4.08 | 4.18 | 3.94 | 3.78 | 3.71 | 3.37 | 3.24 | 2.96 |
| 2012 | 2.51 | 2.19 | 1.86 | 1.71 | 2.08 | 1.95 | 2.37 | 2.27 | 2.42 | 3.20 | 3.44 | 3.26 |
| 2013 | 3.14 | 3.12 | 3.42 | 3.69 | 3.73 | |||||||
| 2019 | 3.14 | |||||||||||
| 2023 | 2.27 | |||||||||||
| 2024 | 2.21 | 1.40 | ||||||||||
| - = No Data Reported; -- = Not Applicable; NA = Not Available; W = Withheld to avoid disclosure of individual company data. |
| Release Date: 6/30/2026 |
| Next Release Date: 7/31/2026 |