|
Download Data (XLS File) |
|
||||||||
|
||||||||
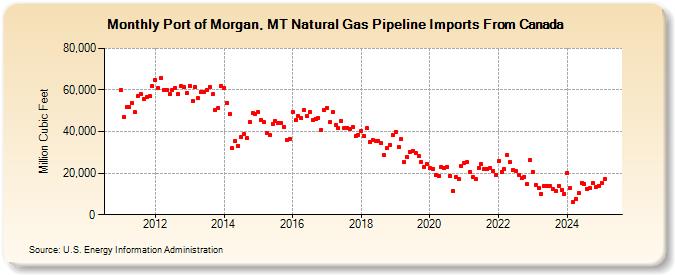
| Port of Morgan, MT Natural Gas Pipeline Imports From Canada (Million Cubic Feet) | ||||||||
| Year | Jan | Feb | Mar | Apr | May | Jun | Jul | Aug | Sep | Oct | Nov | Dec |
|---|---|---|---|---|---|---|---|---|---|---|---|---|
| 2011 | 59,930 | 46,941 | 51,604 | 51,763 | 53,799 | 49,169 | 57,061 | 57,865 | 55,624 | 56,602 | 56,887 | 61,687 |
| 2012 | 64,584 | 60,810 | 65,859 | 60,128 | 60,217 | 58,046 | 60,098 | 61,187 | 58,223 | 61,897 | 61,202 | 58,739 |
| 2013 | 62,146 | 54,658 | 61,395 | 55,965 | 58,896 | 59,252 | 59,822 | 61,514 | 57,958 | 50,249 | 51,376 | 61,921 |
| 2014 | 60,833 | 53,863 | 48,212 | 31,877 | 35,378 | 33,288 | 37,338 | 38,727 | 36,826 | 44,792 | 48,924 | 48,328 |
| 2015 | 49,450 | 45,765 | 44,412 | 39,382 | 38,378 | 43,864 | 45,040 | 44,035 | 44,184 | 42,407 | 35,719 | 36,606 |
| 2016 | 49,336 | 45,373 | 47,569 | 46,449 | 50,302 | 47,311 | 49,354 | 45,686 | 46,268 | 46,612 | 40,811 | 50,138 |
| 2017 | 51,537 | 44,393 | 49,173 | 43,152 | 41,497 | 45,175 | 41,809 | 41,862 | 41,365 | 42,286 | 37,941 | 38,385 |
| 2018 | 40,242 | 37,808 | 41,579 | 35,087 | 35,864 | 35,523 | 35,535 | 34,398 | 28,574 | 32,292 | 33,672 | 38,318 |
| 2019 | 39,991 | 32,419 | 36,238 | 25,164 | 27,648 | 30,332 | 30,721 | 29,576 | 28,419 | 25,240 | 23,067 | 24,445 |
| 2020 | 22,428 | 22,164 | 19,220 | 18,837 | 22,972 | 22,492 | 23,129 | 18,613 | 11,416 | 17,931 | 16,963 | 23,319 |
| 2021 | 24,647 | 25,135 | 20,431 | 18,078 | 17,171 | 22,619 | 24,334 | 21,813 | 21,852 | 22,588 | 20,823 | 18,958 |
| 2022 | 25,825 | 20,740 | 21,910 | 28,875 | 25,193 | 21,665 | 21,244 | 19,125 | 17,547 | 18,296 | 14,685 | 26,365 |
| 2023 | 20,563 | 14,308 | 12,780 | 10,129 | 13,906 | 13,895 | 13,612 | 12,135 | 11,367 | 13,841 | 11,998 | 10,062 |
| 2024 | 20,128 | 12,650 | 6,093 | 7,544 | 10,204 | 15,473 | 14,776 | 12,429 | 12,659 | 15,373 | 13,173 | 14,028 |
| 2025 | 15,263 | 17,105 | 13,529 | 9,838 | 14,021 | 17,653 | 12,948 | 16,029 | 8,471 | 8,304 | 11,480 | 16,480 |
| 2026 | 18,946 | 15,178 | 9,866 | 10,565 | ||||||||
| - = No Data Reported; -- = Not Applicable; NA = Not Available; W = Withheld to avoid disclosure of individual company data. |
| Release Date: 6/30/2026 |
| Next Release Date: 7/31/2026 |