|
Download Data (XLS File) |
|
||||||||
|
||||||||
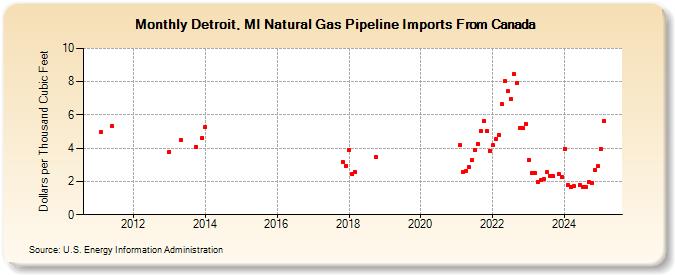
| Detroit, MI Natural Gas Pipeline Imports From Canada (Dollars per Thousand Cubic Feet) | ||||||||
| Year | Jan | Feb | Mar | Apr | May | Jun | Jul | Aug | Sep | Oct | Nov | Dec |
|---|---|---|---|---|---|---|---|---|---|---|---|---|
| 2011 | 4.95 | 5.33 | ||||||||||
| 2013 | 3.80 | 4.50 | 4.09 | 4.63 | ||||||||
| 2014 | 5.26 | |||||||||||
| 2017 | 3.16 | 2.93 | ||||||||||
| 2018 | 3.92 | 2.44 | 2.58 | 3.47 | ||||||||
| 2021 | 4.19 | 2.54 | 2.61 | 2.87 | 3.27 | 3.87 | 4.27 | 5.04 | 5.66 | 5.03 | 3.86 | |
| 2022 | 4.17 | 4.58 | 4.80 | 6.65 | 8.02 | 7.41 | 6.93 | 8.48 | 7.92 | 5.19 | 5.19 | 5.47 |
| 2023 | 3.31 | 2.53 | 2.51 | 1.99 | 2.08 | 2.13 | 2.56 | 2.33 | 2.31 | 2.46 | 2.27 | |
| 2024 | 3.97 | 1.81 | 1.64 | 1.73 | 1.81 | 1.64 | 1.66 | 1.97 | 1.93 | 2.69 | 2.91 | |
| 2025 | 3.96 | 5.66 | 1.73 | 3.08 | 2.56 | 2.98 | 3.04 | 2.77 | 3.34 | |||
| 2026 | 4.44 | 3.97 | 3.15 | 2.56 | ||||||||
| - = No Data Reported; -- = Not Applicable; NA = Not Available; W = Withheld to avoid disclosure of individual company data. |
| Release Date: 6/30/2026 |
| Next Release Date: 7/31/2026 |