|
Download Data (XLS File) |
|
||||||||
|
||||||||
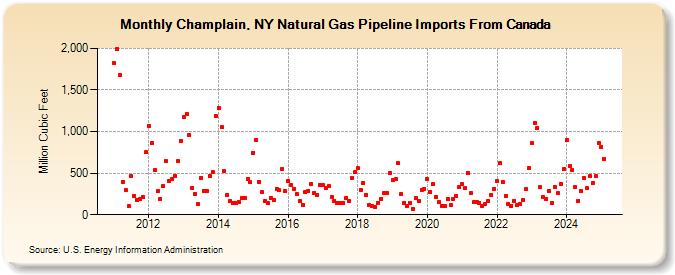
| Champlain, NY Natural Gas Pipeline Imports From Canada (Million Cubic Feet) | ||||||||
| Year | Jan | Feb | Mar | Apr | May | Jun | Jul | Aug | Sep | Oct | Nov | Dec |
|---|---|---|---|---|---|---|---|---|---|---|---|---|
| 2011 | 1,825 | 1,988 | 1,676 | 394 | 292 | 100 | 462 | 224 | 178 | 189 | 214 | 751 |
| 2012 | 1,070 | 862 | 537 | 288 | 186 | 347 | 644 | 403 | 427 | 469 | 640 | 892 |
| 2013 | 1,174 | 1,217 | 956 | 321 | 247 | 128 | 445 | 288 | 287 | 467 | 508 | 1,189 |
| 2014 | 1,289 | 1,051 | 522 | 242 | 169 | 140 | 139 | 154 | 199 | 203 | 424 | 390 |
| 2015 | 746 | 901 | 399 | 276 | 159 | 141 | 204 | 180 | 311 | 297 | 549 | 282 |
| 2016 | 410 | 361 | 313 | 244 | 164 | 122 | 276 | 286 | 371 | 262 | 242 | 356 |
| 2017 | 354 | 318 | 341 | 216 | 168 | 137 | 146 | 146 | 202 | 159 | 442 | 508 |
| 2018 | 556 | 301 | 383 | 242 | 112 | 104 | 95 | 141 | 193 | 266 | 267 | 501 |
| 2019 | 417 | 424 | 618 | 249 | 146 | 109 | 144 | 74 | 200 | 168 | 298 | 310 |
| 2020 | 425 | 279 | 369 | 217 | 149 | 105 | 106 | 186 | 118 | 186 | 226 | 331 |
| 2021 | 371 | 322 | 506 | 257 | 148 | 152 | 144 | 110 | 128 | 166 | 242 | 310 |
| 2022 | 402 | 619 | 399 | 229 | 133 | 109 | 168 | 113 | 123 | 177 | 306 | 563 |
| 2023 | 863 | 1,105 | 1,044 | 330 | 215 | 194 | 291 | 138 | 338 | 257 | 375 | 546 |
| 2024 | 894 | 586 | 532 | 334 | 164 | 288 | 446 | 318 | 465 | 383 | 460 | 862 |
| 2025 | 816 | 673 | 504 | 395 | 150 | 255 | 754 | 425 | 347 | 594 | 450 | 587 |
| 2026 | 513 | 509 | 481 | 363 | ||||||||
| - = No Data Reported; -- = Not Applicable; NA = Not Available; W = Withheld to avoid disclosure of individual company data. |
| Release Date: 6/30/2026 |
| Next Release Date: 7/31/2026 |