|
Download Data (XLS File) |
|
||||||||
|
||||||||
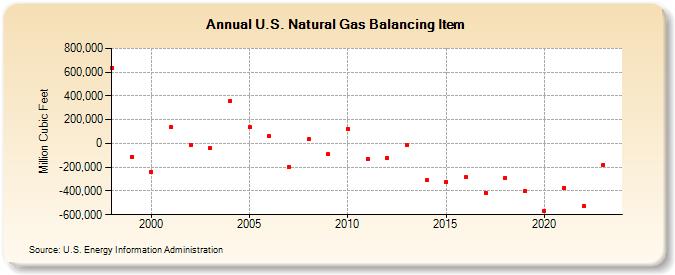
| U.S. Natural Gas Balancing Item (Million Cubic Feet) | ||||||||
| Decade | Year-0 | Year-1 | Year-2 | Year-3 | Year-4 | Year-5 | Year-6 | Year-7 | Year-8 | Year-9 |
|---|---|---|---|---|---|---|---|---|---|---|
| 1990's | 634,809 | -111,218 | ||||||||
| 2000's | -240,342 | 134,346 | -13,339 | -38,495 | 356,956 | 134,293 | 61,404 | -196,323 | 33,472 | -89,392 |
| 2010's | 124,358 | -130,108 | -123,053 | -15,729 | -310,301 | -324,471 | -286,181 | -413,636 | -288,232 | -400,445 |
| 2020's | -565,898 | -372,585 | -528,494 | -25,147 | -391,106 |
| - = No Data Reported; -- = Not Applicable; NA = Not Available; W = Withheld to avoid disclosure of individual company data. |
| Release Date: 6/30/2026 |
| Next Release Date: 7/31/2026 |