|
Download Data (XLS File) |
|
||||||||
|
||||||||
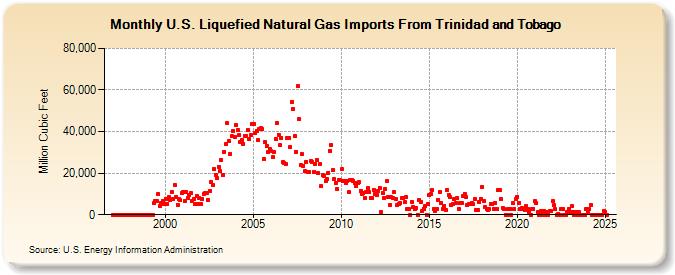
| U.S. Liquefied Natural Gas Imports From Trinidad and Tobago (Million Cubic Feet) | ||||||||
| Year | Jan | Feb | Mar | Apr | May | Jun | Jul | Aug | Sep | Oct | Nov | Dec |
|---|---|---|---|---|---|---|---|---|---|---|---|---|
| 1997 | 0 | 0 | 0 | 0 | 0 | 0 | 0 | 0 | 0 | 0 | 0 | 0 |
| 1998 | 0 | 0 | 0 | 0 | 0 | 0 | 0 | 0 | 0 | 0 | 0 | 0 |
| 1999 | 0 | 0 | 0 | 0 | 5,493 | 6,619 | 6,599 | 9,904 | 4,393 | 5,865 | 6,648 | 5,256 |
| 2000 | 7,780 | 5,168 | 8,393 | 7,285 | 10,723 | 7,390 | 14,307 | 8,435 | 4,864 | 7,392 | 6,950 | 10,262 |
| 2001 | 10,707 | 6,635 | 10,704 | 8,028 | 9,530 | 10,407 | 6,701 | 7,519 | 5,230 | 9,234 | 5,340 | 7,975 |
| 2002 | 5,318 | 7,571 | 10,151 | 10,271 | 10,312 | 7,256 | 11,360 | 15,796 | 14,369 | 22,018 | 19,169 | 17,512 |
| 2003 | 23,113 | 21,007 | 26,353 | 19,184 | 30,336 | 33,889 | 43,874 | 35,466 | 29,312 | 37,828 | 40,295 | 37,414 |
| 2004 | 43,148 | 40,884 | 38,124 | 35,138 | 35,980 | 34,230 | 37,942 | 37,716 | 40,708 | 36,337 | 38,369 | 43,523 |
| 2005 | 43,735 | 39,244 | 40,444 | 35,709 | 41,207 | 41,505 | 41,187 | 26,759 | 34,772 | 33,212 | 30,077 | 31,394 |
| 2006 | 30,480 | 27,620 | 30,209 | 36,437 | 44,346 | 38,568 | 33,390 | 37,043 | 25,197 | 24,677 | 24,583 | 36,718 |
| 2007 | 36,792 | 32,581 | 54,295 | 50,986 | 37,747 | 30,327 | 61,866 | 45,881 | 23,741 | 29,149 | 23,566 | 20,826 |
| 2008 | 25,453 | 20,626 | 20,763 | 26,070 | 25,472 | 20,587 | 24,596 | 26,330 | 19,956 | 24,371 | 13,621 | 18,978 |
| 2009 | 18,825 | 16,019 | 17,064 | 20,212 | 30,885 | 33,574 | 21,334 | 17,161 | 15,493 | 12,547 | 16,543 | 16,545 |
| 2010 | 21,863 | 15,979 | 16,165 | 15,228 | 16,274 | 10,701 | 16,604 | 16,512 | 16,357 | 15,238 | 13,653 | 15,175 |
| 2011 | 15,701 | 11,488 | 9,900 | 10,554 | 8,126 | 10,971 | 12,792 | 10,715 | 8,106 | 8,088 | 12,054 | 10,127 |
| 2012 | 9,482 | 11,283 | 13,029 | 1,447 | 10,611 | 8,256 | 12,345 | 16,084 | 8,484 | 4,748 | 8,297 | 8,143 |
| 2013 | 10,770 | 7,722 | 4,629 | 5,171 | 5,626 | 8,046 | 8,023 | 5,961 | 8,540 | 2,674 | 2,583 | 0 |
| 2014 | 6,207 | 3,783 | 2,701 | 3,006 | 0 | 7,097 | 6,305 | 1,567 | 2,874 | 4,289 | 0 | 4,988 |
| 2015 | 9,382 | 9,830 | 11,770 | 2,844 | 1,673 | 2,557 | 7,133 | 11,161 | 5,609 | 2,653 | 4,373 | 2,453 |
| 2016 | 11,951 | 9,612 | 8,503 | 4,693 | 5,087 | 7,520 | 5,703 | 7,998 | 2,810 | 5,696 | 5,779 | 8,838 |
| 2017 | 10,183 | 8,468 | 4,870 | 4,985 | 5,275 | 5,425 | 4,974 | 7,636 | 2,467 | 2,337 | 6,213 | 7,617 |
| 2018 | 13,511 | 6,750 | 3,650 | 2,934 | 2,429 | 2,688 | 5,376 | 5,231 | 2,961 | 5,696 | 2,734 | 11,859 |
| 2019 | 11,753 | 7,499 | 3,456 | 2,811 | 0 | 0 | 2,832 | 2,886 | 0 | 5,532 | 2,780 | 7,323 |
| 2020 | 8,602 | 5,689 | 2,857 | 3,214 | 2,811 | 2,178 | 4,078 | 2,874 | 1,235 | 0 | 2,841 | 2,853 |
| 2021 | 6,376 | 5,688 | 1,406 | 0 | 1,662 | 0 | 1,714 | 0 | 1,221 | 0 | 1,729 | 1,628 |
| 2022 | 6,381 | 4,448 | 2,600 | 0 | 482 | 0 | 2,736 | 2,862 | 0 | 0 | 1,216 | 2,810 |
| 2023 | 1,329 | 3,992 | 1,324 | 0 | 1,370 | 0 | 1,257 | 0 | 0 | 0 | 0 | 2,657 |
| 2024 | 1,291 | 2,620 | 4,622 | 0 | 0 | 0 | 0 | 0 | 0 | 0 | 0 | 1,910 |
| 2025 | 1,389 | 0 | 0 | 0 | 0 | 0 | 0 | 0 | 2,870 | 0 | 0 | 2,991 |
| 2026 | 10,493 | 2,165 | 0 | 0 | ||||||||
| - = No Data Reported; -- = Not Applicable; NA = Not Available; W = Withheld to avoid disclosure of individual company data. |
| Release Date: 6/30/2026 |
| Next Release Date: 7/31/2026 |