|
Download Data (XLS File) |
|
||||||||
|
||||||||
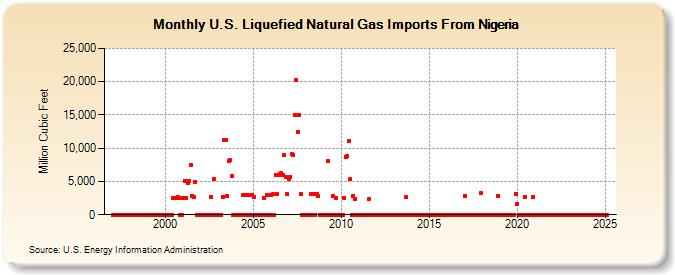
| U.S. Liquefied Natural Gas Imports From Nigeria (Million Cubic Feet) | ||||||||
| Year | Jan | Feb | Mar | Apr | May | Jun | Jul | Aug | Sep | Oct | Nov | Dec |
|---|---|---|---|---|---|---|---|---|---|---|---|---|
| 1997 | 0 | 0 | 0 | 0 | 0 | 0 | 0 | 0 | 0 | 0 | 0 | 0 |
| 1998 | 0 | 0 | 0 | 0 | 0 | 0 | 0 | 0 | 0 | 0 | 0 | 0 |
| 1999 | 0 | 0 | 0 | 0 | 0 | 0 | 0 | 0 | 0 | 0 | 0 | 0 |
| 2000 | 0 | 0 | 0 | 0 | 0 | 2,488 | 2,496 | 2,510 | 2,658 | 2,503 | 0 | 0 |
| 2001 | 2,478 | 5,068 | 2,535 | 4,822 | 5,067 | 7,547 | 2,888 | 2,606 | 4,955 | 0 | 0 | 0 |
| 2002 | 0 | 0 | 0 | 0 | 0 | 0 | 0 | 2,720 | 0 | 5,403 | 0 | 0 |
| 2003 | 0 | 0 | 0 | 2,604 | 11,288 | 11,237 | 2,770 | 8,132 | 8,250 | 5,787 | 0 | 0 |
| 2004 | 0 | 0 | 0 | 0 | 0 | 2,983 | 2,931 | 0 | 2,917 | 0 | 0 | 2,986 |
| 2005 | 2,681 | 0 | 0 | 0 | 0 | 0 | 0 | 2,574 | 0 | 2,895 | 0 | 0 |
| 2006 | 3,028 | 3,053 | 0 | 5,991 | 3,100 | 5,996 | 6,129 | 6,199 | 6,025 | 8,957 | 5,732 | 3,082 |
| 2007 | 5,325 | 5,743 | 9,085 | 9,042 | 14,970 | 20,312 | 12,442 | 15,005 | 3,105 | 0 | 0 | 0 |
| 2008 | 0 | 0 | 0 | 3,042 | 0 | 3,062 | 0 | 3,153 | 2,792 | 0 | 0 | 0 |
| 2009 | 0 | 0 | 0 | 8,050 | 0 | 0 | 2,772 | 0 | 2,484 | 0 | 0 | 0 |
| 2010 | 0 | 0 | 2,564 | 8,745 | 8,805 | 11,093 | 5,295 | 0 | 2,857 | 2,374 | 0 | 0 |
| 2011 | 0 | 0 | 0 | 0 | 0 | 0 | 0 | 2,362 | 0 | 0 | 0 | 0 |
| 2012 | 0 | 0 | 0 | 0 | 0 | 0 | 0 | 0 | 0 | 0 | 0 | 0 |
| 2013 | 0 | 0 | 0 | 0 | 0 | 0 | 0 | 0 | 2,590 | 0 | 0 | 0 |
| 2014 | 0 | 0 | 0 | 0 | 0 | 0 | 0 | 0 | 0 | 0 | 0 | 0 |
| 2015 | 0 | 0 | 0 | 0 | 0 | 0 | 0 | 0 | 0 | 0 | 0 | 0 |
| 2016 | 0 | 0 | 0 | 0 | 0 | 0 | 0 | 0 | 0 | 0 | 0 | 0 |
| 2017 | 2,753 | 0 | 0 | 0 | 0 | 0 | 0 | 0 | 0 | 0 | 0 | 3,239 |
| 2018 | 0 | 0 | 0 | 0 | 0 | 0 | 0 | 0 | 0 | 0 | 0 | 2,860 |
| 2019 | 0 | 0 | 0 | 0 | 0 | 0 | 0 | 0 | 0 | 0 | 0 | 3,154 |
| 2020 | 1,584 | 0 | 0 | 0 | 0 | 2,693 | 0 | 0 | 0 | 0 | 0 | 2,629 |
| 2021 | 0 | 0 | 0 | 0 | 0 | 0 | 0 | 0 | 0 | 0 | 0 | 0 |
| 2022 | 0 | 0 | 0 | 0 | 0 | 0 | 0 | 0 | 0 | 0 | 0 | 0 |
| 2023 | 0 | 0 | 0 | 0 | 0 | 0 | 0 | 0 | 0 | 0 | 0 | 0 |
| 2024 | 0 | 0 | 0 | 0 | 0 | 0 | 0 | 0 | 0 | 0 | 0 | 0 |
| 2025 | 0 | 0 | 0 | 0 | 0 | 0 | 0 | 0 | 0 | 0 | 0 | 0 |
| 2026 | 0 | 0 | 0 | 0 | ||||||||
| - = No Data Reported; -- = Not Applicable; NA = Not Available; W = Withheld to avoid disclosure of individual company data. |
| Release Date: 6/30/2026 |
| Next Release Date: 7/31/2026 |