|
Download Data (XLS File) |
|
||||||||
|
||||||||
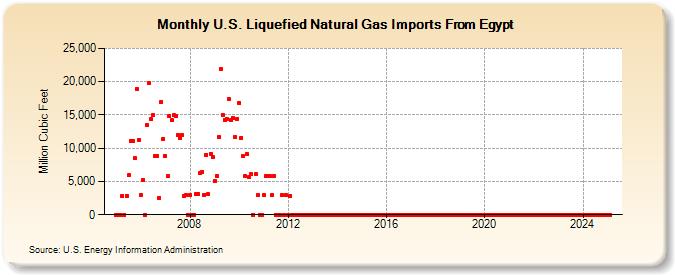
| U.S. Liquefied Natural Gas Imports From Egypt (Million Cubic Feet) | ||||||||
| Year | Jan | Feb | Mar | Apr | May | Jun | Jul | Aug | Sep | Oct | Nov | Dec |
|---|---|---|---|---|---|---|---|---|---|---|---|---|
| 2005 | 0 | 0 | 0 | 2,854 | 0 | 2,865 | 5,926 | 11,127 | 11,036 | 8,523 | 18,945 | 11,263 |
| 2006 | 2,970 | 5,261 | 0 | 13,560 | 19,826 | 14,334 | 15,004 | 8,880 | 8,782 | 2,551 | 16,921 | 11,440 |
| 2007 | 8,803 | 5,778 | 14,783 | 14,218 | 14,914 | 14,804 | 11,948 | 11,585 | 11,985 | 2,789 | 2,973 | 0 |
| 2008 | 2,961 | 0 | 0 | 3,106 | 3,091 | 6,317 | 6,423 | 3,035 | 9,020 | 3,044 | 9,181 | 8,663 |
| 2009 | 5,142 | 5,846 | 11,627 | 21,898 | 14,996 | 14,274 | 14,376 | 17,432 | 14,208 | 14,510 | 11,694 | 14,432 |
| 2010 | 16,826 | 11,572 | 8,780 | 5,823 | 9,118 | 5,714 | 6,054 | 0 | 6,150 | 2,955 | 0 | 0 |
| 2011 | 2,971 | 5,780 | 5,800 | 5,885 | 2,889 | 5,869 | 0 | 0 | 0 | 2,969 | 0 | 2,956 |
| 2012 | 0 | 2,811 | 0 | 0 | 0 | 0 | 0 | 0 | 0 | 0 | 0 | 0 |
| 2013 | 0 | 0 | 0 | 0 | 0 | 0 | 0 | 0 | 0 | 0 | 0 | 0 |
| 2014 | 0 | 0 | 0 | 0 | 0 | 0 | 0 | 0 | 0 | 0 | 0 | 0 |
| 2015 | 0 | 0 | 0 | 0 | 0 | 0 | 0 | 0 | 0 | 0 | 0 | 0 |
| 2016 | 0 | 0 | 0 | 0 | 0 | 0 | 0 | 0 | 0 | 0 | 0 | 0 |
| 2017 | 0 | 0 | 0 | 0 | 0 | 0 | 0 | 0 | 0 | 0 | 0 | 0 |
| 2018 | 0 | 0 | 0 | 0 | 0 | 0 | 0 | 0 | 0 | 0 | 0 | 0 |
| 2019 | 0 | 0 | 0 | 0 | 0 | 0 | 0 | 0 | 0 | 0 | 0 | 0 |
| 2020 | 0 | 0 | 0 | 0 | 0 | 0 | 0 | 0 | 0 | 0 | 0 | 0 |
| 2021 | 0 | 0 | 0 | 0 | 0 | 0 | 0 | 0 | 0 | 0 | 0 | 0 |
| 2022 | 0 | 0 | 0 | 0 | 0 | 0 | 0 | 0 | 0 | 0 | 0 | 0 |
| 2023 | 0 | 0 | 0 | 0 | 0 | 0 | 0 | 0 | 0 | 0 | 0 | 0 |
| 2024 | 0 | 0 | 0 | 0 | 0 | 0 | 0 | 0 | 0 | 0 | 0 | 0 |
| 2025 | 0 | 0 | 0 | 0 | 0 | 0 | 0 | 0 | 0 | 0 | 0 | 0 |
| 2026 | 0 | 0 | 0 | 0 | ||||||||
| - = No Data Reported; -- = Not Applicable; NA = Not Available; W = Withheld to avoid disclosure of individual company data. |
| Release Date: 6/30/2026 |
| Next Release Date: 7/31/2026 |