|
Download Data (XLS File) |
|
||||||||
|
||||||||
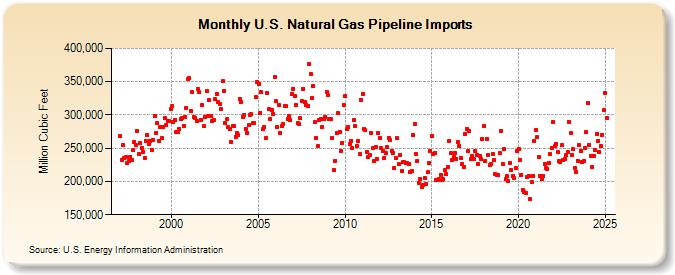
| U.S. Natural Gas Pipeline Imports (Million Cubic Feet) | ||||||||
| Year | Jan | Feb | Mar | Apr | May | Jun | Jul | Aug | Sep | Oct | Nov | Dec |
|---|---|---|---|---|---|---|---|---|---|---|---|---|
| 1997 | 268,310 | 232,878 | 254,455 | 235,621 | 236,725 | 227,059 | 230,567 | 237,149 | 232,119 | 246,707 | 259,656 | 255,149 |
| 1998 | 276,173 | 241,275 | 257,866 | 250,612 | 244,713 | 235,852 | 261,233 | 269,948 | 257,009 | 261,040 | 247,971 | 262,913 |
| 1999 | 297,724 | 273,524 | 288,520 | 261,258 | 282,063 | 265,218 | 282,301 | 294,745 | 285,441 | 291,345 | 290,977 | 308,959 |
| 2000 | 313,092 | 289,953 | 291,785 | 274,637 | 274,616 | 278,529 | 293,379 | 295,365 | 283,131 | 297,137 | 310,567 | 353,376 |
| 2001 | 354,873 | 306,190 | 334,858 | 296,560 | 294,734 | 290,824 | 339,472 | 334,220 | 293,037 | 314,389 | 283,195 | 296,461 |
| 2002 | 335,437 | 298,346 | 322,445 | 297,903 | 291,312 | 292,178 | 323,240 | 331,839 | 318,707 | 316,006 | 308,739 | 350,581 |
| 2003 | 336,055 | 287,797 | 293,362 | 281,973 | 279,344 | 258,964 | 282,729 | 282,616 | 266,841 | 273,482 | 269,978 | 324,089 |
| 2004 | 319,783 | 296,970 | 299,959 | 279,043 | 273,379 | 284,744 | 299,561 | 300,740 | 287,583 | 287,786 | 327,506 | 349,489 |
| 2005 | 347,187 | 302,957 | 333,765 | 278,581 | 281,369 | 265,332 | 332,952 | 308,175 | 294,082 | 306,729 | 301,411 | 357,234 |
| 2006 | 320,850 | 282,308 | 315,065 | 273,456 | 283,263 | 286,389 | 313,374 | 312,849 | 293,510 | 297,831 | 291,883 | 331,964 |
| 2007 | 339,699 | 328,773 | 314,931 | 288,095 | 285,893 | 294,883 | 320,231 | 339,062 | 319,730 | 315,286 | 314,068 | 376,118 |
| 2008 | 361,237 | 326,061 | 343,104 | 289,904 | 265,557 | 253,846 | 291,791 | 293,283 | 282,101 | 293,914 | 297,452 | 334,154 |
| 2009 | 329,817 | 293,657 | 293,580 | 265,807 | 217,001 | 231,217 | 272,463 | 302,255 | 274,840 | 246,067 | 258,186 | 314,512 |
| 2010 | 328,175 | 278,308 | 281,677 | 256,909 | 260,993 | 249,738 | 292,383 | 283,321 | 252,926 | 260,680 | 241,582 | 323,054 |
| 2011 | 331,655 | 279,147 | 276,870 | 244,811 | 236,032 | 239,270 | 273,250 | 250,028 | 231,467 | 251,450 | 233,640 | 272,133 |
| 2012 | 265,323 | 249,762 | 245,881 | 235,466 | 242,811 | 251,476 | 265,808 | 262,250 | 246,489 | 243,051 | 219,643 | 235,180 |
| 2013 | 264,580 | 225,497 | 239,999 | 215,438 | 228,558 | 228,644 | 228,087 | 227,439 | 226,931 | 214,871 | 216,001 | 270,453 |
| 2014 | 286,787 | 241,571 | 231,458 | 197,634 | 203,841 | 191,829 | 194,850 | 204,968 | 195,856 | 213,858 | 227,457 | 245,694 |
| 2015 | 267,751 | 241,996 | 242,585 | 202,209 | 202,623 | 203,656 | 209,779 | 202,649 | 203,150 | 217,576 | 210,704 | 221,613 |
| 2016 | 261,521 | 242,019 | 232,164 | 236,522 | 243,088 | 234,229 | 259,224 | 253,883 | 235,594 | 225,671 | 221,949 | 271,910 |
| 2017 | 278,666 | 246,094 | 275,656 | 233,077 | 238,831 | 234,140 | 245,292 | 239,997 | 226,769 | 238,859 | 233,906 | 263,583 |
| 2018 | 283,223 | 230,617 | 264,248 | 239,095 | 224,488 | 225,537 | 241,382 | 231,529 | 210,896 | 209,023 | 209,652 | 242,347 |
| 2019 | 276,363 | 225,750 | 249,443 | 203,685 | 207,613 | 201,133 | 227,550 | 217,167 | 208,264 | 204,977 | 220,952 | 245,539 |
| 2020 | 248,824 | 232,624 | 210,337 | 186,812 | 183,681 | 182,571 | 206,315 | 208,445 | 172,968 | 199,273 | 208,704 | 261,108 |
| 2021 | 277,665 | 266,160 | 237,292 | 208,342 | 203,194 | 207,835 | 226,033 | 220,929 | 218,947 | 228,156 | 240,639 | 250,963 |
| 2022 | 289,757 | 253,436 | 256,816 | 244,816 | 230,218 | 228,677 | 254,283 | 232,808 | 233,738 | 239,263 | 244,760 | 289,926 |
| 2023 | 272,526 | 239,838 | 248,059 | 220,081 | 214,456 | 231,189 | 254,571 | 246,160 | 229,807 | 230,723 | 250,869 | 274,069 |
| 2024 | 318,619 | 255,492 | 238,691 | 221,836 | 238,416 | 246,700 | 271,374 | 260,815 | 244,396 | 253,872 | 270,365 | 307,156 |
| 2025 | 333,845 | 295,207 | 262,888 | 236,062 | 240,262 | 246,233 | 257,570 | 237,524 | 222,477 | 232,356 | 264,082 | 321,054 |
| 2026 | 328,655 | 273,595 | 238,532 | 216,503 | ||||||||
| - = No Data Reported; -- = Not Applicable; NA = Not Available; W = Withheld to avoid disclosure of individual company data. |
| Release Date: 6/30/2026 |
| Next Release Date: 7/31/2026 |