|
Download Data (XLS File) |
|
||||||||
|
||||||||
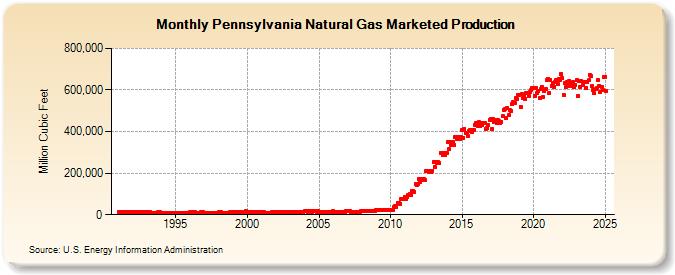
| Pennsylvania Natural Gas Marketed Production (Million Cubic Feet) | ||||||||
| Year | Jan | Feb | Mar | Apr | May | Jun | Jul | Aug | Sep | Oct | Nov | Dec |
|---|---|---|---|---|---|---|---|---|---|---|---|---|
| 1991 | 13,236 | 11,888 | 12,984 | 12,312 | 12,209 | 11,851 | 12,106 | 12,070 | 11,725 | 12,768 | 12,753 | 13,255 |
| 1992 | 12,056 | 10,761 | 11,506 | 11,128 | 11,217 | 10,867 | 11,091 | 10,968 | 10,846 | 11,641 | 11,530 | 12,024 |
| 1993 | 11,197 | 10,031 | 10,882 | 10,455 | 10,605 | 10,194 | 10,441 | 10,459 | 10,282 | 11,016 | 11,067 | 11,592 |
| 1994 | 10,249 | 9,182 | 9,961 | 9,570 | 9,708 | 9,331 | 9,558 | 9,574 | 9,412 | 10,084 | 10,130 | 10,611 |
| 1995 | 9,441 | 8,458 | 9,175 | 8,815 | 8,942 | 8,595 | 8,804 | 8,819 | 8,669 | 9,288 | 9,331 | 9,774 |
| 1996 | 11,698 | 10,449 | 11,261 | 10,799 | 10,876 | 10,436 | 10,597 | 10,603 | 10,452 | 11,388 | 11,410 | 11,948 |
| 1997 | 6,914 | 6,177 | 6,657 | 6,383 | 6,429 | 6,169 | 6,264 | 6,268 | 6,179 | 6,732 | 6,744 | 7,063 |
| 1998 | 11,426 | 10,205 | 10,997 | 10,546 | 10,621 | 10,193 | 10,350 | 10,355 | 10,209 | 11,121 | 11,142 | 11,668 |
| 1999 | 15,166 | 13,547 | 14,600 | 14,000 | 14,100 | 13,530 | 13,739 | 13,747 | 13,551 | 14,764 | 14,792 | 15,490 |
| 2000 | 12,846 | 11,477 | 12,369 | 11,861 | 11,945 | 11,462 | 11,638 | 11,647 | 11,480 | 12,509 | 12,533 | 13,125 |
| 2001 | 11,115 | 9,932 | 10,705 | 10,264 | 10,337 | 9,919 | 10,070 | 10,079 | 9,934 | 10,826 | 10,846 | 11,359 |
| 2002 | 13,444 | 12,012 | 12,946 | 12,414 | 12,502 | 11,996 | 12,180 | 12,190 | 12,015 | 13,093 | 13,118 | 13,737 |
| 2003 | 13,803 | 12,331 | 13,289 | 12,743 | 12,834 | 12,315 | 12,505 | 12,513 | 12,334 | 13,439 | 13,464 | 14,100 |
| 2004 | 17,107 | 16,403 | 16,559 | 15,428 | 15,600 | 15,776 | 15,457 | 15,956 | 15,829 | 16,365 | 15,306 | 17,153 |
| 2005 | 14,555 | 13,956 | 14,089 | 13,127 | 13,273 | 13,423 | 13,151 | 13,576 | 13,468 | 13,924 | 13,023 | 14,595 |
| 2006 | 15,601 | 14,958 | 15,101 | 14,070 | 14,226 | 14,387 | 14,096 | 14,551 | 14,435 | 14,924 | 13,959 | 15,643 |
| 2007 | 16,162 | 15,496 | 15,644 | 14,575 | 14,738 | 14,904 | 14,603 | 15,074 | 14,954 | 15,461 | 14,460 | 16,205 |
| 2008 | 17,582 | 16,858 | 17,019 | 15,856 | 16,033 | 16,214 | 15,886 | 16,399 | 16,268 | 16,819 | 15,731 | 17,629 |
| 2009 | 24,283 | 23,283 | 23,505 | 21,899 | 22,143 | 22,393 | 21,940 | 22,649 | 22,468 | 23,230 | 21,727 | 24,348 |
| 2010 | 22,711 | 20,513 | 22,711 | 38,523 | 39,808 | 38,523 | 55,148 | 55,148 | 53,369 | 76,303 | 73,842 | 76,303 |
| 2011 | 84,273 | 76,117 | 84,273 | 95,355 | 98,533 | 95,355 | 114,248 | 114,248 | 110,562 | 147,462 | 142,705 | 147,462 |
| 2012 | 170,613 | 159,605 | 170,613 | 165,109 | 170,613 | 165,109 | 211,446 | 211,446 | 204,625 | 211,446 | 204,625 | 211,446 |
| 2013 | 254,726 | 230,075 | 254,726 | 246,509 | 254,726 | 246,509 | 298,505 | 298,505 | 288,876 | 298,505 | 288,876 | 298,505 |
| 2014 | 348,235 | 314,535 | 348,235 | 337,002 | 348,235 | 337,002 | 374,771 | 374,771 | 362,682 | 374,771 | 362,682 | 374,771 |
| 2015 | 408,019 | 370,836 | 413,155 | 392,752 | 391,332 | 376,856 | 401,777 | 409,771 | 398,110 | 407,234 | 409,344 | 433,795 |
| 2016 | 442,434 | 426,244 | 444,309 | 426,424 | 439,310 | 431,137 | 440,575 | 439,910 | 414,330 | 417,455 | 431,708 | 456,371 |
| 2017 | 460,047 | 414,569 | 459,451 | 446,734 | 457,522 | 442,640 | 456,133 | 449,310 | 442,607 | 446,747 | 472,918 | 504,961 |
| 2018 | 506,627 | 464,245 | 512,261 | 479,217 | 504,572 | 496,644 | 531,811 | 541,144 | 537,370 | 562,502 | 554,480 | 573,960 |
| 2019 | 576,440 | 519,802 | 578,820 | 560,062 | 571,803 | 556,708 | 583,186 | 585,405 | 568,646 | 589,800 | 597,779 | 608,342 |
| 2020 | 607,508 | 573,083 | 608,611 | 587,519 | 592,791 | 561,050 | 605,095 | 615,949 | 567,259 | 596,140 | 605,718 | 648,178 |
| 2021 | 652,283 | 585,293 | 649,393 | 620,194 | 635,492 | 616,203 | 638,130 | 646,670 | 627,305 | 651,674 | 646,383 | 678,051 |
| 2022 | 657,816 | 577,435 | 634,530 | 614,765 | 638,730 | 616,815 | 644,242 | 635,607 | 618,560 | 637,253 | 613,196 | 624,618 |
| 2023 | 645,116 | 571,130 | 639,305 | 613,311 | 641,713 | 620,765 | 635,103 | 638,619 | 604,935 | 636,766 | 645,599 | 673,269 |
| 2024 | 666,020 | 617,929 | 601,193 | 583,413 | 602,978 | 611,021 | 649,924 | 621,102 | 589,542 | 615,138 | 600,083 | 663,960 |
| 2025 | 661,844 | 591,278 | 657,896 | 633,473 | 652,821 | 644,572 | 651,416 | 646,896 | 615,177 | 616,283 | 632,897 | 671,238 |
| 2026 | 660,820 | 599,029 | 658,866 | 630,394 | ||||||||
| - = No Data Reported; -- = Not Applicable; NA = Not Available; W = Withheld to avoid disclosure of individual company data. |
| Release Date: 6/30/2026 |
| Next Release Date: 7/31/2026 |