|
Download Data (XLS File) |
|
||||||||
|
||||||||
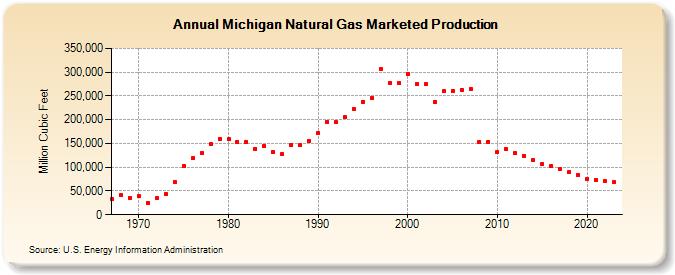
| Michigan Natural Gas Marketed Production (Million Cubic Feet) | ||||||||
| Decade | Year-0 | Year-1 | Year-2 | Year-3 | Year-4 | Year-5 | Year-6 | Year-7 | Year-8 | Year-9 |
|---|---|---|---|---|---|---|---|---|---|---|
| 1960's | 33,589 | 40,480 | 36,163 | |||||||
| 1970's | 38,851 | 25,662 | 34,221 | 44,579 | 69,133 | 102,113 | 119,262 | 129,954 | 148,047 | 159,731 |
| 1980's | 158,302 | 152,593 | 153,051 | 138,910 | 144,537 | 131,855 | 127,287 | 146,996 | 146,145 | 155,988 |
| 1990's | 172,151 | 195,749 | 194,815 | 204,635 | 222,657 | 238,203 | 245,740 | 305,950 | 278,076 | 277,364 |
| 2000's | 296,556 | 275,036 | 274,476 | 236,987 | 259,681 | 261,112 | 263,009 | 264,907 | 153,130 | 153,736 |
| 2010's | 131,118 | 138,162 | 129,333 | 123,622 | 115,065 | 107,664 | 102,003 | 96,451 | 89,572 | 83,969 |
| 2020's | 75,935 | 74,057 | 69,919 | 68,316 | 64,129 |
| - = No Data Reported; -- = Not Applicable; NA = Not Available; W = Withheld to avoid disclosure of individual company data. |
| Release Date: 5/29/2026 |
| Next Release Date: 6/30/2026 |