|
Download Data (XLS File) |
|
||||||||
|
||||||||
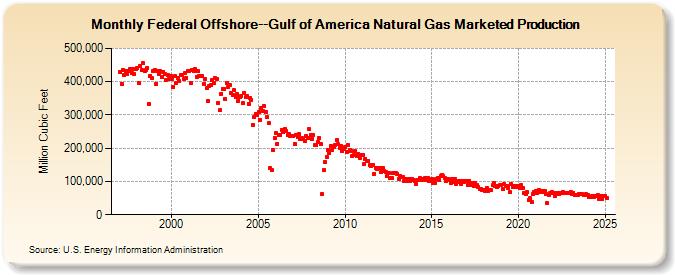
| Federal Offshore--Gulf of America Natural Gas Marketed Production (Million Cubic Feet) | ||||||||
| Year | Jan | Feb | Mar | Apr | May | Jun | Jul | Aug | Sep | Oct | Nov | Dec |
|---|---|---|---|---|---|---|---|---|---|---|---|---|
| 1997 | 429,954 | 394,104 | 436,222 | 420,503 | 432,864 | 423,879 | 431,157 | 436,557 | 425,610 | 437,613 | 422,552 | 438,287 |
| 1998 | 441,123 | 396,059 | 445,905 | 435,635 | 455,211 | 432,364 | 436,068 | 440,131 | 333,302 | 418,456 | 410,971 | 431,271 |
| 1999 | 434,362 | 393,604 | 433,239 | 423,001 | 430,700 | 412,522 | 429,904 | 422,444 | 406,218 | 419,349 | 407,540 | 416,820 |
| 2000 | 408,729 | 383,253 | 415,559 | 396,563 | 410,962 | 402,645 | 419,724 | 420,167 | 408,426 | 425,402 | 411,945 | 431,012 |
| 2001 | 430,983 | 395,500 | 435,869 | 432,270 | 438,105 | 414,729 | 431,138 | 417,185 | 415,814 | 415,922 | 393,187 | 406,921 |
| 2002 | 380,858 | 342,512 | 386,489 | 389,271 | 405,288 | 395,390 | 410,179 | 408,567 | 337,089 | 313,851 | 363,903 | 378,545 |
| 2003 | 377,658 | 347,678 | 394,477 | 384,508 | 389,501 | 367,394 | 359,839 | 373,553 | 353,443 | 361,792 | 343,101 | 353,506 |
| 2004 | 356,246 | 335,068 | 366,069 | 352,815 | 357,859 | 334,081 | 351,567 | 345,224 | 270,637 | 295,034 | 304,120 | 300,730 |
| 2005 | 308,164 | 285,262 | 321,813 | 311,388 | 327,490 | 308,970 | 293,430 | 275,411 | 139,135 | 134,230 | 194,683 | 232,113 |
| 2006 | 244,584 | 213,829 | 239,860 | 238,542 | 256,010 | 247,754 | 256,378 | 250,819 | 238,653 | 242,261 | 235,960 | 237,319 |
| 2007 | 235,396 | 213,877 | 238,889 | 232,357 | 242,298 | 228,908 | 231,048 | 228,054 | 221,195 | 238,095 | 231,929 | 256,671 |
| 2008 | 241,064 | 228,507 | 239,263 | 209,165 | 208,428 | 219,044 | 230,193 | 211,888 | 61,961 | 133,579 | 157,377 | 173,874 |
| 2009 | 195,525 | 184,696 | 207,335 | 195,000 | 203,298 | 210,961 | 223,920 | 211,532 | 200,721 | 207,439 | 190,220 | 198,268 |
| 2010 | 202,102 | 188,046 | 209,373 | 193,806 | 192,728 | 177,531 | 178,573 | 190,298 | 177,334 | 183,545 | 171,021 | 180,704 |
| 2011 | 178,597 | 152,160 | 168,311 | 160,766 | 162,416 | 149,309 | 147,208 | 149,986 | 123,410 | 141,464 | 137,005 | 141,696 |
| 2012 | 139,540 | 128,722 | 140,948 | 131,788 | 128,938 | 116,156 | 126,404 | 108,952 | 109,626 | 125,393 | 124,245 | 126,851 |
| 2013 | 122,965 | 108,629 | 116,449 | 114,285 | 113,213 | 102,690 | 108,099 | 102,742 | 107,506 | 100,771 | 106,685 | 105,214 |
| 2014 | 100,331 | 93,672 | 103,355 | 104,532 | 109,505 | 105,713 | 108,233 | 109,003 | 104,827 | 109,013 | 100,081 | 105,411 |
| 2015 | 105,908 | 94,048 | 95,632 | 107,100 | 111,365 | 105,365 | 116,654 | 119,136 | 116,224 | 110,894 | 101,386 | 108,235 |
| 2016 | 104,422 | 96,715 | 106,846 | 97,457 | 106,386 | 93,331 | 99,010 | 101,907 | 93,762 | 100,613 | 97,909 | 102,311 |
| 2017 | 101,241 | 88,438 | 101,570 | 90,813 | 95,226 | 86,756 | 93,891 | 88,828 | 84,427 | 76,498 | 78,045 | 74,720 |
| 2018 | 74,419 | 71,334 | 80,445 | 72,407 | 74,841 | 75,759 | 88,177 | 94,288 | 85,177 | 82,681 | 86,794 | 88,539 |
| 2019 | 90,143 | 76,743 | 92,017 | 87,201 | 87,738 | 81,599 | 66,834 | 91,237 | 84,094 | 86,636 | 83,661 | 87,441 |
| 2020 | 86,086 | 81,086 | 87,958 | 80,586 | 64,690 | 62,543 | 68,021 | 44,177 | 49,062 | 38,839 | 60,793 | 67,649 |
| 2021 | 71,804 | 64,043 | 74,201 | 69,762 | 72,051 | 67,424 | 71,746 | 61,409 | 34,553 | 60,037 | 65,566 | 68,035 |
| 2022 | 64,214 | 56,646 | 64,336 | 65,439 | 61,940 | 64,142 | 66,255 | 68,061 | 64,597 | 66,181 | 64,316 | 64,351 |
| 2023 | 69,527 | 60,915 | 65,721 | 60,000 | 57,739 | 57,890 | 61,094 | 61,465 | 62,188 | 60,574 | 58,180 | 61,014 |
| 2024 | 59,619 | 55,191 | 54,762 | 57,053 | 53,989 | 55,424 | 58,908 | 59,391 | 47,783 | 58,697 | 50,345 | 59,021 |
| 2025 | 55,794 | 50,055 | 57,773 | 55,528 | 52,836 | 58,751 | 61,983 | 63,223 | 60,380 | 64,117 | 61,323 | 64,469 |
| 2026 | 65,811 | 55,760 | 62,902 | 63,460 | ||||||||
| - = No Data Reported; -- = Not Applicable; NA = Not Available; W = Withheld to avoid disclosure of individual company data. |
| Release Date: 6/30/2026 |
| Next Release Date: 7/31/2026 |