|
Download Data (XLS File) |
|
||||||||
|
||||||||
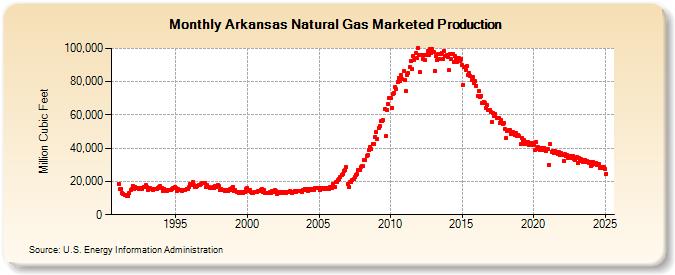
| Arkansas Natural Gas Marketed Production (Million Cubic Feet) | ||||||||
| Year | Jan | Feb | Mar | Apr | May | Jun | Jul | Aug | Sep | Oct | Nov | Dec |
|---|---|---|---|---|---|---|---|---|---|---|---|---|
| 1991 | 18,557 | 15,232 | 15,650 | 12,922 | 12,723 | 11,663 | 11,664 | 11,030 | 10,969 | 13,035 | 14,626 | 15,413 |
| 1992 | 17,448 | 15,594 | 16,819 | 16,212 | 16,124 | 15,615 | 15,902 | 15,908 | 15,720 | 16,944 | 16,929 | 17,693 |
| 1993 | 16,637 | 14,909 | 16,191 | 15,496 | 15,723 | 15,096 | 15,502 | 15,537 | 15,274 | 16,347 | 16,416 | 17,188 |
| 1994 | 16,031 | 14,367 | 15,601 | 14,932 | 15,151 | 14,546 | 14,938 | 14,972 | 14,718 | 15,752 | 15,819 | 16,563 |
| 1995 | 15,924 | 14,270 | 15,497 | 14,832 | 15,049 | 14,449 | 14,837 | 14,871 | 14,619 | 15,646 | 15,713 | 16,451 |
| 1996 | 18,240 | 17,725 | 19,603 | 17,583 | 16,846 | 16,942 | 17,462 | 17,791 | 18,066 | 18,270 | 19,210 | 18,960 |
| 1997 | 19,147 | 16,377 | 17,592 | 16,681 | 16,463 | 16,016 | 16,184 | 16,444 | 15,765 | 17,062 | 16,538 | 17,895 |
| 1998 | 17,083 | 14,601 | 15,669 | 14,896 | 14,688 | 14,284 | 14,397 | 14,673 | 14,066 | 15,220 | 14,771 | 16,045 |
| 1999 | 16,924 | 14,156 | 14,840 | 13,735 | 13,877 | 12,776 | 12,782 | 13,449 | 13,287 | 13,547 | 13,576 | 15,234 |
| 2000 | 16,082 | 14,299 | 15,010 | 13,394 | 13,327 | 13,166 | 13,679 | 13,752 | 13,661 | 14,532 | 14,216 | 15,055 |
| 2001 | 15,682 | 13,947 | 14,650 | 13,068 | 13,000 | 12,840 | 13,341 | 13,397 | 13,333 | 14,184 | 13,861 | 14,653 |
| 2002 | 14,003 | 12,373 | 13,539 | 13,148 | 13,884 | 12,959 | 13,626 | 13,587 | 13,259 | 13,685 | 13,419 | 13,854 |
| 2003 | 14,341 | 13,068 | 13,895 | 13,717 | 14,369 | 13,879 | 14,404 | 14,396 | 13,978 | 14,101 | 13,778 | 15,057 |
| 2004 | 15,614 | 14,859 | 15,254 | 14,464 | 15,469 | 15,136 | 15,660 | 15,639 | 15,091 | 16,318 | 15,867 | 16,334 |
| 2005 | 16,003 | 14,588 | 16,222 | 15,423 | 15,850 | 15,354 | 15,958 | 16,129 | 15,290 | 16,425 | 15,898 | 16,104 |
| 2006 | 18,564 | 16,963 | 19,775 | 19,583 | 21,066 | 21,488 | 22,660 | 23,974 | 24,216 | 26,490 | 26,946 | 28,568 |
| 2007 | 18,443 | 16,860 | 19,663 | 19,472 | 21,025 | 21,454 | 22,608 | 23,935 | 24,263 | 26,648 | 26,939 | 28,577 |
| 2008 | 29,080 | 29,093 | 32,985 | 33,054 | 35,343 | 35,817 | 38,881 | 40,643 | 39,422 | 42,569 | 42,590 | 46,978 |
| 2009 | 49,687 | 45,489 | 51,988 | 53,156 | 56,232 | 56,269 | 56,946 | 63,399 | 47,081 | 62,811 | 66,462 | 70,433 |
| 2010 | 70,090 | 64,185 | 72,476 | 73,441 | 76,493 | 75,428 | 79,952 | 82,398 | 80,506 | 83,827 | 81,433 | 86,409 |
| 2011 | 81,103 | 74,280 | 83,876 | 84,985 | 88,538 | 92,271 | 87,562 | 95,326 | 93,145 | 96,973 | 94,201 | 99,952 |
| 2012 | 95,833 | 85,648 | 95,824 | 93,751 | 95,914 | 92,918 | 95,758 | 98,362 | 96,053 | 99,575 | 97,043 | 99,491 |
| 2013 | 97,739 | 86,529 | 95,219 | 92,948 | 96,878 | 93,664 | 96,471 | 97,267 | 93,665 | 98,343 | 95,147 | 95,784 |
| 2014 | 94,869 | 86,784 | 96,520 | 93,375 | 96,739 | 92,022 | 95,474 | 94,382 | 92,090 | 94,412 | 92,488 | 93,578 |
| 2015 | 90,125 | 78,244 | 88,895 | 87,268 | 89,391 | 84,124 | 85,281 | 83,696 | 81,253 | 82,974 | 78,977 | 80,153 |
| 2016 | 77,592 | 71,658 | 74,247 | 70,504 | 71,555 | 67,073 | 68,009 | 66,959 | 63,989 | 65,709 | 62,826 | 63,075 |
| 2017 | 61,589 | 55,892 | 61,289 | 59,338 | 60,578 | 57,974 | 58,436 | 58,001 | 55,441 | 56,821 | 54,320 | 54,996 |
| 2018 | 51,300 | 46,194 | 50,569 | 50,857 | 51,030 | 48,815 | 49,419 | 49,558 | 47,639 | 49,135 | 47,258 | 48,212 |
| 2019 | 47,443 | 42,219 | 46,211 | 44,455 | 44,906 | 42,702 | 43,852 | 43,505 | 41,798 | 43,093 | 41,738 | 42,834 |
| 2020 | 42,203 | 39,110 | 43,673 | 39,766 | 40,490 | 38,760 | 39,876 | 40,320 | 38,758 | 40,196 | 38,584 | 39,470 |
| 2021 | 39,288 | 30,185 | 42,468 | 37,756 | 38,563 | 36,921 | 38,047 | 37,755 | 36,527 | 37,648 | 36,102 | 37,023 |
| 2022 | 36,108 | 32,336 | 36,319 | 35,043 | 35,781 | 34,299 | 35,096 | 35,394 | 34,212 | 35,113 | 33,571 | 32,954 |
| 2023 | 34,453 | 30,847 | 34,035 | 32,542 | 33,332 | 31,965 | 32,772 | 32,651 | 31,589 | 32,302 | 31,134 | 31,907 |
| 2024 | 29,057 | 29,488 | 31,356 | 29,816 | 30,605 | 29,249 | 30,081 | 30,018 | 28,959 | 29,559 | 28,638 | 28,483 |
| 2025 | 27,605 | 24,712 | 27,815 | 26,747 | 27,702 | 26,552 | 27,294 | 27,371 | 26,305 | 27,243 | 26,267 | 27,711 |
| 2026 | 26,337 | 24,163 | 26,955 | 25,862 | ||||||||
| - = No Data Reported; -- = Not Applicable; NA = Not Available; W = Withheld to avoid disclosure of individual company data. |
| Release Date: 6/30/2026 |
| Next Release Date: 7/31/2026 |