|
Download Data (XLS File) |
|
||||||||
|
||||||||
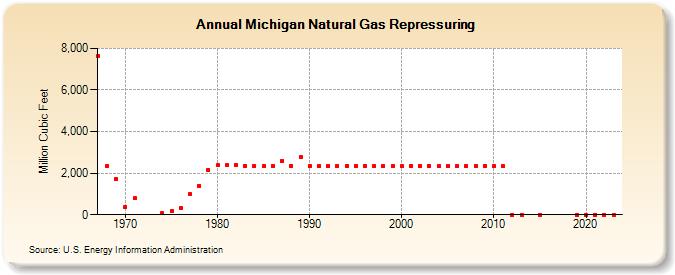
| Michigan Natural Gas Repressuring (Million Cubic Feet) | ||||||||
| Decade | Year-0 | Year-1 | Year-2 | Year-3 | Year-4 | Year-5 | Year-6 | Year-7 | Year-8 | Year-9 |
|---|---|---|---|---|---|---|---|---|---|---|
| 1960's | 7,642 | 2,330 | 1,719 | |||||||
| 1970's | 378 | 788 | 63 | 176 | 327 | 981 | 1,401 | 2,169 | ||
| 1980's | 2,375 | 2,390 | 2,400 | 2,340 | 2,340 | 2,340 | 2,340 | 2,606 | 2,340 | 2,768 |
| 1990's | 2,340 | 2,340 | 2,340 | 2,340 | 2,340 | 2,340 | 2,340 | 2,340 | 2,340 | 2,340 |
| 2000's | 2,340 | 2,340 | 2,340 | 2,340 | 2,340 | 2,340 | 2,340 | 2,340 | 2,340 | 2,340 |
| 2010's | 2,340 | 2,340 | 0 | 0 | NA | 0 | NA | NA | NA | 0 |
| 2020's | 0 | 0 | 0 | 0 | 0 |
| - = No Data Reported; -- = Not Applicable; NA = Not Available; W = Withheld to avoid disclosure of individual company data. |
| Release Date: 6/30/2026 |
| Next Release Date: 7/31/2026 |